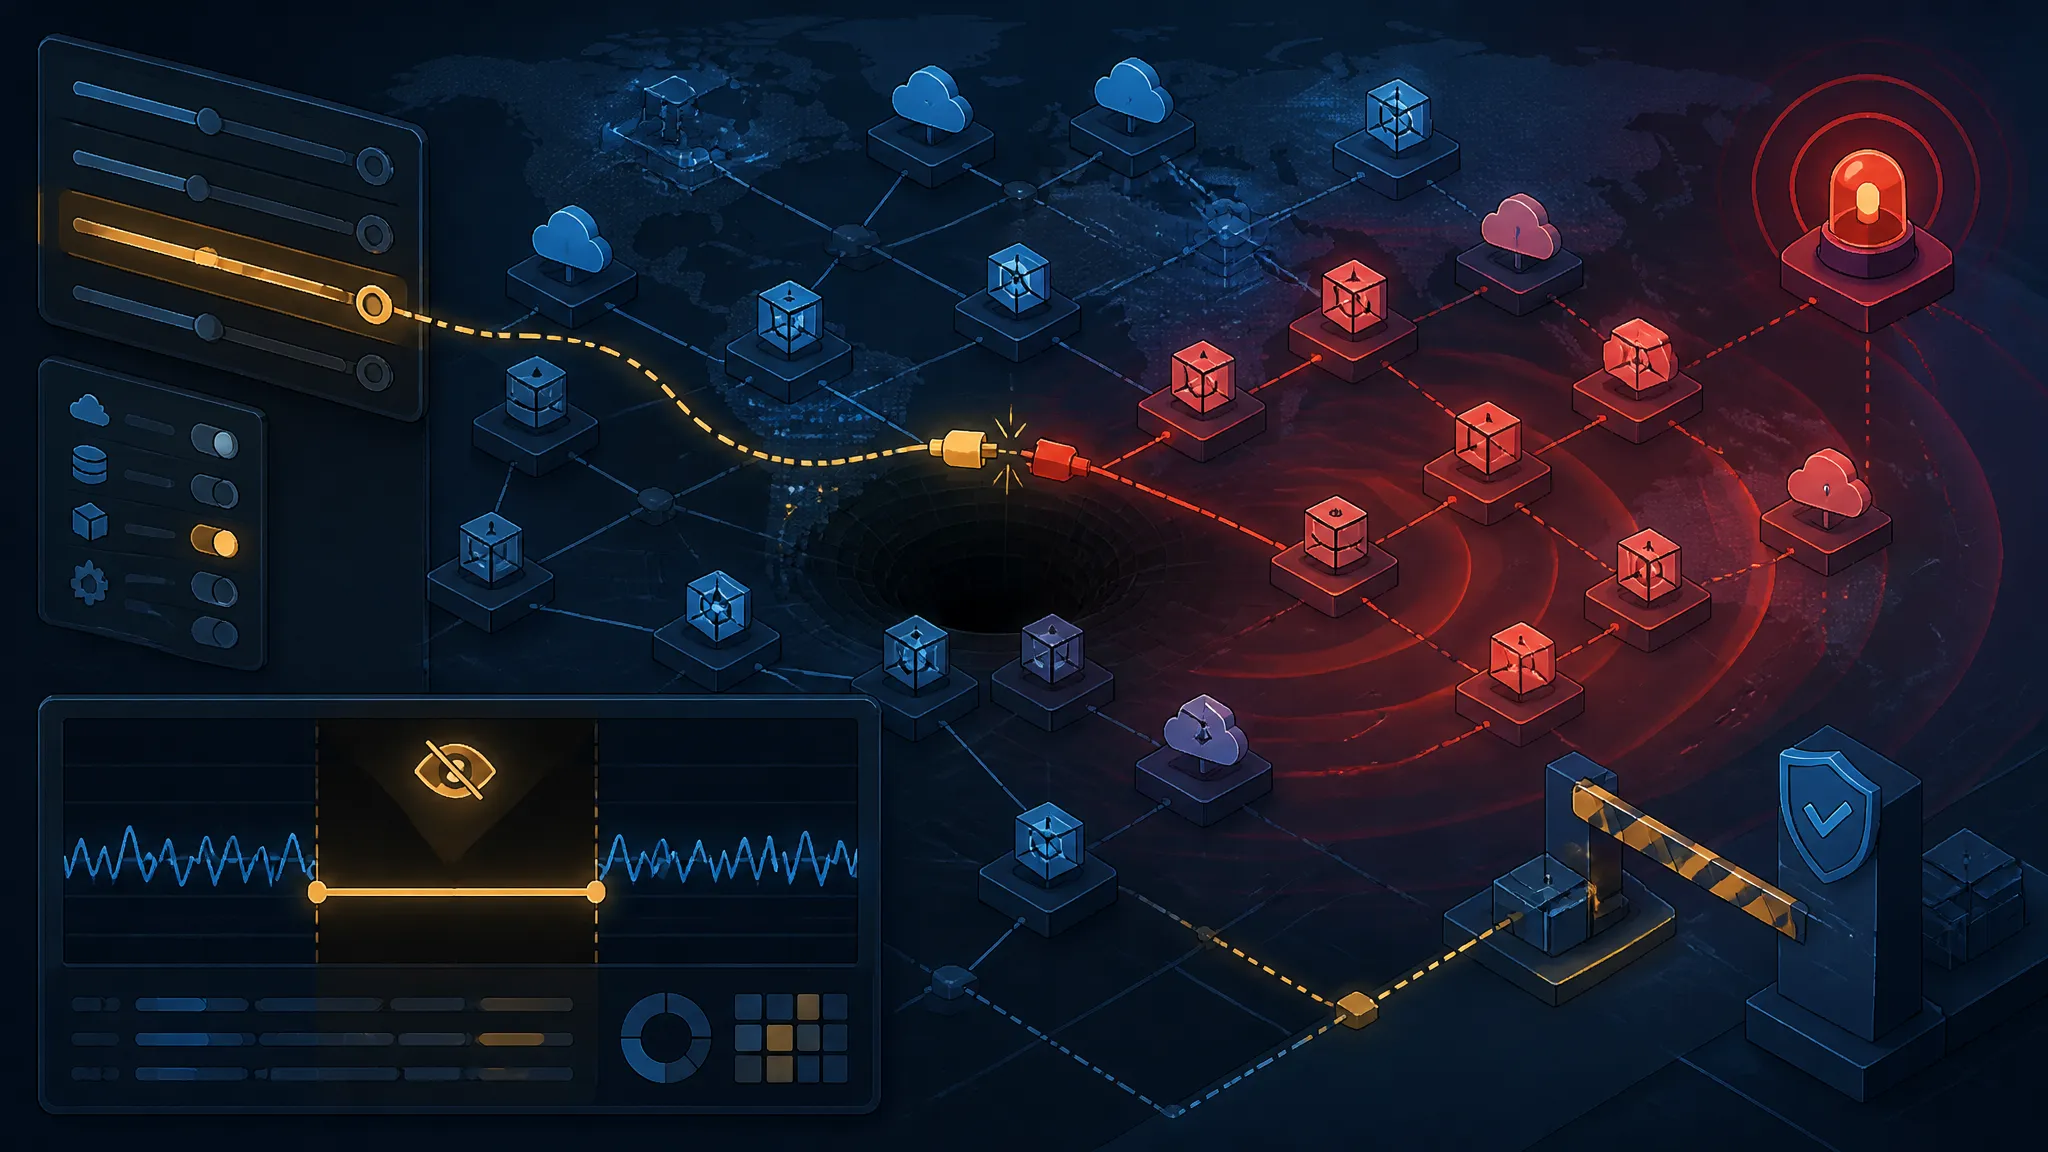
Silent Configuration Drift: What the Microsoft 365 Outage Reveals About Detection Gaps
On this page
The Microsoft 365 Outage Was a Symptom, Not the Incident
The number that matters most in the Microsoft 365 outage coverage isn't the user count. It's four months.
Coverage published on 16 and 17 November 2026 by The Business Times, Solutions Review, HOLR Magazine, and The Sun Malaysia describes a Microsoft bug that sat undetected since July, contributed to a worldwide Microsoft 365 disruption, prompted a public apology, and shipped alongside a disclosure of three underlying causes. The coverage leans on "Friday the 13th," which pins the peak of the disruption to 13 November 2026.
The interesting part is what's missing from that record. Four months means the system was up and wrong in the same window, and nothing in the detection chain had an opinion about "wrong." This post is about that gap: how silent configuration drift survives liveness monitoring, what the public record does and does not establish about the outage, and a conformance detector you can build and run this week — code, fixture, and observed output included.
So the position I'll argue here is specific: configuration state needs its own assertions, separate from liveness probes, and "three causes" is a communications artifact until Microsoft publishes the mechanics. A four-month detection window isn't an availability failure. Availability failures are noisy: a probe flips red, a page fires, someone rolls back. That's a correctness problem dressed as an availability problem — and it's a failure class most monitoring stacks can't represent at all.
What the Microsoft 365 Outage Record Actually Establishes
Confirmed by the reporting (timeline, scope, apology, three disclosed causes)
Stripping out the framing, here's what's actually reported:
| Claim | Status in the reporting |
|---|---|
| A Microsoft bug went undetected from some point in July 2026 | Stated |
| The bug contributed to a worldwide Microsoft 365 disruption | Stated |
| The disruption affected thousands of users | Stated |
| Microsoft issued an apology | Stated |
| Microsoft disclosed three underlying causes | Stated |
| Coverage dates | 16–17 November 2026 |
| Apparent peak | 13 November 2026 ("Friday the 13th" framing) |
That's a short list. Not one line names a subsystem.
What the reports do not say — root cause detail, affected component names, whether the July bug ever shipped to all tenants
Here's what the reporting I worked from doesn't contain:
- the name of the affected component or service
- the mechanism — no mention of throttling, routing, identity, storage, or queueing
- whether the three causes were independent faults, a chain, or one fault plus amplifiers
- whether the July change reached all tenants or only a subset
- whether the July change was code, configuration, or data
- any version, build identifier, or CVE-style record
- whether the July condition was latent (harmless until something else changed) or degraded-but-tolerable
I'm being deliberate about this list, because filling in any of it would be fiction. What the reporting establishes is a detection window and a blast radius — not a mechanism.
Why 'three causes' is a narrative shape, not a technical finding
"Three causes" survives editing because it sounds precise. Technically it's ambiguous across at least three different structures:
- Three independent faults — each individually sufficient to degrade something during the window.
- One fault with two amplifiers — e.g. a latent limit plus a retry storm plus a control-plane dependency, where removing any one of the three would have prevented the outage.
- A cascade — cause A produced condition B, which triggered cause C.
Those aren't stylistic differences. They change the mitigation: structure 1 needs three detection gates, structure 2 needs one assertion plus a load-shape test (two more gates would be wasted effort), and structure 3 puts the highest-leverage fix at the first hop.
Until a postmortem says which, "three causes" tells you about the shape of the disclosure, not the failure. My read — and I'll flag this as inference, not reported fact — is that structure 2 is the common shape for "undetected since July," since a purely latent fault that nobody notices for four months usually needs a second thing to arrive before it's visible.
Silent Configuration Drift Is a Correctness Problem, Not an Availability Problem
Two signal classes: liveness (is it up?) versus conformance (is it still configured the way we decided it should be?)
Nearly every monitoring stack I audit weights liveness heavily and conformance lightly, if at all.
- Liveness asks whether a process is answering and whether a normal request succeeds.
- Conformance asks whether the system's state — configuration, policy, limits, routing, feature flags — still equals the state you decided on.
They fail independently. A service can be 100% live and 0% conformant with every liveness signal green the whole way. In practice that state has a name: silent drift.
Why uptime checks structurally cannot see a latent config bug
A liveness probe samples one code path at one scale. It answers "did this succeed?" It can't answer "would this succeed at 40× concurrency, with a retry storm, on the second hop, for a tenant whose namespace resolves differently than the one I'm probing?"
A latent config bug is a value that isn't binding under probe conditions. The probe exercises the value's non-binding regime and reports success, and keeps reporting it as long as the load path stays inside the envelope. The probe isn't broken — it's answering a different question from the one the incident asks.
A worked example — a namespace/policy value set in July that only matters under a November-sized load path
This example is constructed to illustrate the failure shape. It is not a claim about Microsoft's internal configuration, which the public reporting does not describe.
Take a routing service with a per-namespace throttle ceiling:
{
  "routing": {
    "throttleCeilingPerNamespace": 12000,
    "fallbackNamespace": "prod-primary-a",
    "retryBudget": { "maxAttempts": 3, "baseDelayMs": 250 }
  }
}
In July someone changes throttleCeilingPerNamespace from 12000 to 4000. It validates: 4000 is legal, within the platform maximum, and above the observed peak for every namespace anyone checked. Staging passes. The change ships.
For four months, nothing binds. Peak traffic stays under 4000 in the probed namespaces, and the probe uses a namespace that never gets close to the ceiling anyway.
Then a load path the July reviewer never modelled arrives: a downstream dependency slows, clients retry, and maxAttempts amplification drives offered load past 4000. Now the ceiling binds. The throttle rejects, clients retry harder, rejects increase. The failure is self-reinforcing — which is why it produces a prolonged disruption instead of a blip.
Every liveness probe stayed green until the ceiling bound, and stayed green afterward, because the probe never touched the namespace under pressure. The system didn't become unavailable. It became wrong about how much work it would accept, and the only signal that changed was a customer-visible one.
Signal class comparison table (probe type, question answered, what it misses)
| Probe type | Question it answers | What it structurally misses |
|---|---|---|
| TCP / process check | Is something listening? | Whether the listener does the right thing |
HTTP 200 on /health | Is the app process alive? | Anything about state, config, or scale |
| Synthetic transaction (golden path) | Does one request complete right now? | Values that only bind under load, on other paths, or for other tenants |
| Status page | What are customers reporting? | Anything that has not produced a visible symptom yet |
| Load-shaped canary | Does it survive at N× concurrency? | Failure modes above N, and cross-tenant or global state |
| Config conformance assertion | Is state still equal to the value we decided on? | Whether the decided value was right; anything outside the asserted scope |
The last row is the one almost nobody has, and the only one that would have had something to say between July and November.
The Four-Month Blind Spot: Why Nothing Alerted Between July and November
Synthetic probes exercise a narrow golden path
Synthetic monitoring is a sampling strategy, and every sample encodes an assumption about what "normal" looks like. A probe that logs in, opens a document, and asserts a 200 covers a narrow slice: one identity class, one tenant shape, one data volume, one concurrency level, one regional ingress. Real traffic is a distribution. The probe is a point sample from the middle of it.
Widen the probe and it gets slower and more brittle; narrow it and it stops being representative. The tension isn't fixable with better probes, which is why the answer is a different signal class instead of a better probe.
Status-page reporting reflects customer-visible symptoms, not internal state
A status page sits downstream of detection, and detection sits downstream of the same blind spot. If nothing internal asserts conformance, the only path to a status-page update is a customer-visible symptom. That makes the status page structurally late. It can't be early, because it has no input that arrives before the symptom.
Worth saying plainly, since teams keep treating the status page as a monitoring feed. It isn't one. It's a communications artifact driven by symptom detection.
No assertion on config state anywhere in the detection chain
The four-month window fits a detection chain shaped like this:
liveness probes ──► alerting ──► on-call
      │
customer reports ──► support ──► status page
Nothing in that chain reads configuration. If the July change was a configuration or policy value — and the reporting doesn't say it was — then no component in the chain could have had an opinion about it even in principle. The monitors didn't miss the bug. The bug was outside their vocabulary.
Inference vs. fact: what a vendor postmortem would need to state to confirm this reading
To move this from a plausible reading to a confirmed one, a postmortem would need to state:
- The class of change made in July: code, config, policy, or data.
- Whether it was latent for four months or degrading throughout — i.e. did it produce any measurable signal before November?
- What made it bind in November — load, a second change, a dependency behaviour, or a data-shape change.
- Which detection surfaces existed for that class of change at the time.
- Whether the July change reached 100% of tenants or only a cohort.
- How the three disclosed causes relate — independent, sequential, or layered.
If item 1 turns out to be "code," my framing narrows: the argument about conformance assertions applies to deployment state instead of a config value, and the detector design changes but the conclusion doesn't. If item 2 turns out to be "degrading throughout with signals nobody acted on," this isn't a detection-class gap at all — it's an alerting and ownership gap, which is a different article. I can't tell which from the public record, and I'm not going to pretend I can.
Building a Configuration Drift Detector You Can Actually Ship
Step 1 — write invariants down as data, not as tribal knowledge
Drift usually goes undetected not because the check is hard but because nobody wrote down what the value was supposed to be. The invariant lives in a senior engineer's head and leaves when that engineer changes teams.
Write it down as data, with a rationale and a severity:
{
"service": "tenant-routing",
"invariants": [
  {
    "path": "routing.throttleCeilingPerNamespace",
    "expect": 12000,
    "severity": "page",
    "why": "binding ceiling; below this, retry amplification collapses success rate"
  },
  {
    "path": "routing.fallbackNamespace",
    "expect": "prod-primary-a",
    "severity": "page"
  },
  {
    "path": "routing.retryBudget.maxAttempts",
    "expect": 3,
    "severity": "warn"
  },
  {
    "path": "tenancy.isolationMode",
    "expect": "namespace",
    "severity": "page"
  }
]
}
The why field isn't decoration. It's what stops the next person from "cleaning up" an invariant that looked arbitrary. An invariant without a rationale gets deleted in the first false-positive cleanup.
Step 2 — snapshot, normalize, diff (Node.js example against a config API)
Three operations, in order: flatten to leaf paths, drop volatile fields, fingerprint secrets. Flattening makes diffs path-addressable so you can attach severity to a specific leaf. Dropping volatile fields (etag, revision, updatedAt) prevents constant churn. Fingerprinting secrets lets you detect rotation without putting credentials in a log.
import { readFile, writeFile } from "node:fs/promises";


const VOLATILE = new Set(["etag", "revision", "updatedAt", "lastModified"]);
const SECRET = new Set(["apiKey", "clientSecret", "sasToken"]);
const SALT = process.env.DRIFT_SALT ?? "";
const fingerprint = (v) =>
"hmac:" + createHmac("sha256", SALT).update(String(v)).digest("hex").slice(0, 12);

function leaves(value, prefix = "", out = {}) {
for (const [k, v] of Object.entries(value)) {
  if (VOLATILE.has(k)) continue;
  const path = prefix ? prefix + "." + k : k;
  if (v && typeof v === "object" && !Array.isArray(v)) leaves(v, path, out);
  else out[path] = SECRET.has(k) ? fingerprint(v) : v;
}
return out;
}

const [cmd, ...rest] = process.argv.slice(2);
const arg = (name) => {
const i = rest.indexOf("--" + name);
return i === -1 ? undefined : rest[i + 1];
};

const res = await fetch(arg("url"), {
headers: { authorization: "Bearer " + process.env.CONFIG_TOKEN },
});
if (!res.ok) { console.error("fetch failed: " + res.status); process.exit(3); }

const current = leaves(await res.json());

if (cmd === "capture") {
await writeFile(arg("out"), JSON.stringify(current, null, 2) + "
");
console.log("captured " + Object.keys(current).length + " leaf paths -> " + arg("out"));
process.exit(0);
}

const baseline = JSON.parse(await readFile(arg("baseline"), "utf8"));
const { invariants } = JSON.parse(await readFile(arg("invariants"), "utf8"));
const sev = (p) => invariants.find((i) => i.path === p)?.severity ?? "info";
const rank = (s) => (s === "page" ? 2 : s === "warn" ? 1 : 0);

let worst = 0;

// Conformance: is it what we decided?
for (const inv of invariants) {
if (JSON.stringify(current[inv.path]) !== JSON.stringify(inv.expect)) {
  console.log(
    "VIOLATION " + inv.path + " expected " + inv.expect +
    " got " + current[inv.path] + " [" + inv.severity + "]"
  );
  worst = Math.max(worst, rank(inv.severity));
}
}

// Drift: did it change since we last looked?
const paths = [...new Set([...Object.keys(baseline), ...Object.keys(current)])].sort();
let changed = 0;
for (const p of paths) {
if (JSON.stringify(baseline[p]) === JSON.stringify(current[p])) continue;
changed++;
console.log("DIFF " + p + " " + baseline[p] + " -> " + current[p] + " [" + sev(p) + "]");
worst = Math.max(worst, rank(sev(p)));
}

console.log("OK " + (Object.keys(current).length - changed) + " unchanged paths");
process.exit(worst);
Keep conformance and drift as two separate passes. A drift check compares against a baseline, so it can't see drift that happened before the baseline was captured. Invariant assertions compare against the decided value, which catches a stale baseline. Running only one of these is the most common way a drift detector quietly becomes useless.
Step 3 — classify the diff as expected variance, warning, or page-someone
Every real config surface has leaves that legitimately change: autoscaling bounds, cache TTLs tuned by a job, feature flags flipped by product. Page on all of them and the detector gets muted inside a week. Classify at the leaf level, and give info changes somewhere to land that isn't the pager:
| Class | Examples | Destination |
|---|---|---|
info | TTL tuning, feature flag flips, capacity bounds | Dashboard / weekly digest |
warn | Retry budget, timeouts, batch sizes | Ticket, reviewed at next standup |
page | Isolation mode, fallback target, binding ceilings, authz policy | On-call, immediately |
refuse | Any change with no matching change record | Block the deploy, not the alert |
Exit codes follow the classification, so the detector works as a gate as well as an alerter: 0 clean, 1 warn, 2 page, 3 fetch error. Don't collapse fetch errors into 0 — an unreachable config API isn't conformance.
Step 4 — run it against a local fixture you can reproduce
Pointing this at a real vendor API would make the output unverifiable. So here's a local fixture that serves two shapes, letting the whole run reproduce on your machine.
import { createServer } from "node:http";

const shapes = {
baseline: {
  routing: {
    throttleCeilingPerNamespace: 12000,
    fallbackNamespace: "prod-primary-a",
    retryBudget: { maxAttempts: 3, baseDelayMs: 250 },
  },
  tenancy: { isolationMode: "namespace", defaultNamespace: "prod-primary-a" },
  cache: { ttlSeconds: 60, negativeTtlSeconds: 5 },
  revision: "a91f2",
  updatedAt: "2026-11-13T09:00:00Z",
},
drifted: {
  routing: {
    throttleCeilingPerNamespace: 4000,
    fallbackNamespace: "prod-primary-a",
    retryBudget: { maxAttempts: 8, baseDelayMs: 250 },
  },
  tenancy: { isolationMode: "namespace", defaultNamespace: "prod-primary-a" },
  cache: { ttlSeconds: 60, negativeTtlSeconds: 5 },
  revision: "b07c4",
  updatedAt: "2026-11-13T09:04:00Z",
},
};

const shape = shapes[process.env.MODE ?? "baseline"];

createServer((_req, res) => {
res.setHeader("content-type", "application/json");
res.end(JSON.stringify(shape));
}).listen(8787, () => console.log("fixture on :8787 mode=" + (process.env.MODE ?? "baseline")));
Run it:
MODE=baseline node fixture.mjs &
CONFIG_TOKEN=dummy DRIFT_SALT=local node drift.mjs capture \
  --url http://127.0.0.1:8787/config --out baseline.json
kill %1

MODE=drifted node fixture.mjs &
CONFIG_TOKEN=dummy DRIFT_SALT=local node drift.mjs check \
  --url http://127.0.0.1:8787/config \
  --baseline baseline.json --invariants invariants.json
echo "exit=$?"
Observed output:
captured 8 leaf paths -> baseline.json
VIOLATION routing.throttleCeilingPerNamespace expected 12000 got 4000 [page]
VIOLATION routing.retryBudget.maxAttempts expected 3 got 8 [warn]
DIFF routing.throttleCeilingPerNamespace 12000 -> 4000 [page]
DIFF routing.retryBudget.maxAttempts 3 -> 8 [warn]
OK 6 unchanged paths
exit=2
Note what isn't there: a clean-looking success line. OK 6 unchanged paths is a count, not a verdict. exit=2 is the verdict.
The duplicated lines are intentional. VIOLATION answers "is it what we decided?" and DIFF answers "did it move?" When baseline and invariant agree, you get two lines per problem. When they disagree — baseline captured after a drift, say — only VIOLATION fires, which is exactly the scenario where a baseline-only detector stays silent forever.
revision and updatedAt differ between the two shapes and produced no diff. That's normalization doing its job. Without the VOLATILE filter, this run would have emitted two noise diffs on every check.
Handling secrets and rate limits without leaking credentials into logs
Three rules, each of which I've seen violated in production:
- Token from environment, never argv.
--tokenshows up inpsoutput and shell history.CONFIG_TOKENdoesn't. - Fingerprint, don't drop. A dropped secret is invisible to drift detection, so secret rotation looks identical to no change. An HMAC with a local salt is stable across runs and useless to anyone reading the log.
- Hash before you print, not after. Every
console.login the loop printscurrent[path], which is already fingerprinted. No path in this script puts a raw secret on stdout.
On rate limits: don't poll fast. Fetch on a change event where the API offers one; otherwise cache with ETag/If-None-Match and treat 304 as "no change, nothing to diff." Handle 429 with Retry-After honored and jittered backoff, and alert on repeated 429 separately from drift — a detector that's being rate-limited isn't asserting anything.
Change Management: Three Causes Means Three Missed Gates
If "three causes" is the amplifier shape I inferred earlier, then three causes means three points where the change could have been stopped and wasn't. Each is a gate class worth naming.
Review that validates intent but never scopes blast radius
Code review and change review both optimize for intent: does this do what the author says it does? The question that catches latent bugs is different: what's the largest population this value affects, and under what conditions does it start to matter?
For a config value that question is cheap to answer and almost never asked. A reviewer who writes "affects all namespaces; binds above 4000 concurrent offers; currently unexercised" into the change record has done more for reliability than one who ran the linter.
The 'it passed staging' trap when staging and production share a control plane
Staging is a scale test wearing a correctness test's clothes. If staging and production share a control plane — same identity provider, same routing layer, same quota service, same feature-flag backend — then staging exercises production's shared state at tiny load. It can't exercise the load-dependent interaction, and a change that mutates shared state can pass staging because staging is small.
The check isn't "did it pass staging?" It's "which inputs to this change are shared with production, and which of those are load-sensitive?" If the answer includes anything shared and anything load-sensitive, a green staging run isn't evidence.
Canary percentage is not blast-radius control when the failure mode is global state
Canary logic assumes the failure mode is per-request: the bad version affects the requests it serves, so route 1% and watch. That assumption breaks when the failure mode is state — a config value that changes global behavior, a policy write, a cache key change, a namespace default.
A 1% canary that writes a global value has 100% blast radius. Worse, the canary signal can look clean, because 1% of traffic may not be enough to make a load-sensitive value bind. Canary percentages measure traffic exposure, not state exposure, and the two diverge exactly in the cases that cause prolonged outages.
What a change record should carry: reversibility, detection plan, and an owner
| Field | Question it forces | Bad answer |
|---|---|---|
| Reversibility | What is the rollback, and how long does it take? | "Revert the commit" (the config ships separately) |
| Detection plan | What asserts this is correct, and when does it run? | "Monitoring will catch it" |
| Blast radius | Largest population affected; conditions under which it binds | "Low risk" |
| Owner | A person, not a team | "Platform" |
| Expiry | When does this value need re-justification? | (blank) |
The detection plan field is the one that would have most changed the July outcome. It's also the one teams skip, because "monitoring will catch it" is easier to write than to falsify.
Blast Radius You Inherit: Vendor Coupling in Productivity Clouds
Shared control planes mean your failover plan may share a failure domain with your primary
Here's the uncomfortable part of third-party productivity platforms: your availability strategy is often built on the same control plane as your dependency.
If your failover path is "route to the secondary tenant when the primary degrades," that failover runs through the same identity, routing, and policy infrastructure as the primary. That isn't redundancy — it's the same failure domain under two names. A global control-plane event hits both, and the failover mechanism itself may be non-functional at the exact moment you need it, which turns a degraded mode into a hard stop.
The test I'd run: for each dependency, name a control plane the failover path doesn't share with the primary. If you can't name one, the failover is a runbook entry, not a capability.
What you can control on your side and what you genuinely cannot
| Controllable | Not controllable |
|---|---|
| Which invariants you assert on your own integration config | Vendor's internal configuration |
| Whether you detect vendor degradation from telemetry you scrape yourself | Vendor's internal detection speed |
| Fail-closed vs fail-degraded decisions per workflow | Vendor's incident cadence |
| Whether your runbooks have been exercised | Whether the vendor's change review scopes blast radius |
| Whether your comms say what is unknown | Whether the postmortem contains mechanism detail |
Engineering time poured into the right-hand column goes to die. The left-hand column is where it pays back.
Playbook Additions for Teams That Depend on Productivity Clouds
Dependency inventory with a degraded-mode contract per dependency
For each external dependency, write down what "degraded" means for your workflows, not the vendor's service. "Email send fails" and "calendar reads are slow" are different contract items with different acceptable behavior.
Scrape vendor telemetry you can verify, not just the status page
The status page is symptom-driven, so it's always late for the reasons above. Where the vendor exposes signed telemetry, health endpoints, or per-tenant signals you can query, scrape them into your own monitoring so detection doesn't depend on the vendor's detection.
Pre-decide fail-closed versus fail-degraded per workflow before the incident
Decide during the incident and you'll decide badly, under time pressure, with an audience. Decide beforehand:
- Fail-closed: authentication, authorization, anything where a wrong answer is worse than no answer.
- Fail-degraded: read paths, notifications, non-security-critical enrichment.
This table should exist before you need it, and it should name the person who can change a row.
A short incident-comms template that says what is unknown, not just what is being investigated
Most incident comms fail by omission: they list what's under investigation and leave the reader to assume the rest is fine. Name the unknowns explicitly.
Status: degraded | affected: <workflows, not services>
Confirmed: <what you have directly observed, with a timestamp>
Unknown: <what you have not established yet, stated plainly>
Not affected: <only what you have actually verified>
Next update: <absolute time>
Workaround: <yes/no, and what it costs the user>
"Unknown: whether the July change applies to all tenants" beats "we are investigating reports of intermittent issues," because it tells the reader what you don't know — which is the information they need to make their own decisions.
A 30-Minute Drift Audit You Can Run This Week
Checklist of highest-value invariants to assert first
Roughly in order of how often they cause incidents:
- Authorization and isolation settings — tenancy mode, namespace defaults, policy attachment.
- Binding limits — rate limits, quota ceilings, concurrency caps, pool sizes.
- Retry and timeout budgets — these are amplifiers; a change here turns a blip into an outage.
- Fallback and failover targets — the values that decide what happens next.
- Cache TTLs and negative-cache settings — quiet correctness bugs live here.
- Feature-flag defaults for security-relevant flags.
Eight to fifteen invariants is a good starting set. A hundred is a project nobody finishes.
Reproducible commands and expected output shape
Start with the zero-code version before you build anything:
## canonical snapshot: sorted keys, volatile fields dropped
curl -sS "$CONFIG_URL" -H "Authorization: Bearer $CONFIG_TOKEN" \
  | jq -S 'del(.revision, .updatedAt, .etag)' > snapshot.json

## record and compare
sha256sum snapshot.json
diff -u baseline.json snapshot.json
Clean run expected shape:
3f9c1a0d7b21e4c8... snapshot.jsonA hash and an empty diff. Drifted run expected shape:
--- baseline.json
+++ snapshot.json
@@
-  "throttleCeilingPerNamespace": 12000,
+  "throttleCeilingPerNamespace": 4000,
If diff output is large and mostly reordering, your canonicalization is wrong — jq -S sorts keys but arrays keep their order. Sort arrays where order isn't semantic, and document the ones where it is.
Interpreting the results — what a clean run does and does not prove
A clean run proves one thing: the values you chose to assert still match the values you recorded.
It does not prove the values are correct. An invariant list captures your current beliefs, and if a belief was wrong in July, asserting it faithfully in November reproduces the bug instead of catching it. It doesn't prove anything outside the asserted scope is fine. And it doesn't prove the system is available — conformance and liveness are independent signals, which is the entire argument of this post.
Where This Reasoning Breaks Down
Limits of the public evidence and claims that would need confirmation
The strongest form of my argument needs facts the public record doesn't contain. Specifically:
- If the July change was code, not configuration, a conformance detector on config state wouldn't have caught it — the analogue is deployment-state assertion and the detector design is different. Untested / unconfirmed.
- If the degradation was visible in telemetry throughout and simply not acted on, this is an alerting and ownership failure, not a detection-class gap. Unconfirmed.
- Reading "three causes" as one fault plus amplifiers is my inference from the four-month window, not a reported finding. Inference.
Better to state those three outright than write a confident article that quietly assumes them.
Cost of drift detection — noise, API churn, and maintenance drag
Drift detection carries real costs, and pretending otherwise is why these systems get abandoned in month three:
- Noise. Every legitimate autoscaling bound change is a diff. Without per-leaf classification and a dashboard tier, you'll mute the whole thing.
- API churn. Config APIs aren't stable interfaces. Fields get renamed, nested, deprecated, and each one breaks your leaf paths. Budget for it.
- Baseline staleness. A baseline that's never refreshed stops being meaningful; one refreshed too often hides slow drift. Neither cadence is free.
- False authority. A green conformance check invites the conclusion that config is fine. It only means the asserted subset is fine.
My honest position: eight to fifteen invariants, reviewed quarterly, owned by a named person, is worth the cost. Two hundred invariants on an unreviewed baseline is worse than nothing, because it produces confidence without coverage.
Further Reading
The primary source for this incident — Microsoft's own postmortem and status history — is the document that would resolve every unknown here, and it wasn't in the material I worked from. The reporting I used was aggregated coverage from The Business Times, Solutions Review, HOLR Magazine, and The Sun Malaysia, published 16–17 November 2026; the aggregator redirect URLs I received weren't stable enough to cite directly.
For the underlying engineering practice:
- Monitoring Distributed Systems — Google SRE Book, chapter 6. The four golden signals, and why alerting on symptoms beats alerting on causes.
- Postmortem Culture: Learning from Failure — Google SRE Workbook. Useful as a checklist for what a postmortem must state to be actionable; several items in my "would need to confirm" list come from this shape.
- JSON Schema — for expressing config invariants as machine-checkable data instead of a bespoke format.
Conclusion: Monitor the State, Not Just the Uptime
A bug that goes undetected from July to November isn't a monitoring outage. It's a vocabulary gap: the detection chain had no concept of "configured incorrectly," so it reported health for four months while silent configuration drift accumulated a condition that would eventually bind.
The fix is narrower than "better observability" and more concrete than "improve change management." Write down the values you've decided on, assert them on a schedule, classify the diffs so the pager stays trustworthy, and treat conformance as a first-class signal independent of liveness. It's maybe eighty lines of Node and a JSON file, and it would have had something to say in August.
Monitor the state, not just the uptime. The uptime was never the problem.
More posts
The SecOps Gaps I Keep Seeing in Growing SaaS Companies
A practical look at the security operations problems that show up as SaaS teams grow fast, from weak logging and unclear ownership to alert fatigue and incident response that breaks under pressure.
Testing Email, Teams, and Copilot Fallbacks Against an M365 Control-Plane Outage
A technical walkthrough for validating email, Teams, and Copilot fallback paths when a Microsoft 365 control-plane outage disrupts authentication, routing, and dependent services.

Testing Tencent Hy4 Flash on Long-Context RAG: Cost, Latency, and Recall Tradeoffs
We benchmark Tencent Hy4 Flash on long-context RAG, measuring cost, latency, and recall tradeoffs to see where its 1M-token context and $0.07 per million token pricing actually pay off.
Loading comments…