Why Parallel Agent Orchestration Can Cost More Tokens Than It Saves: Testing DeepSeek's Super-Agent
On this page
What the DeepSeek Super-Agent Reports Actually Establish
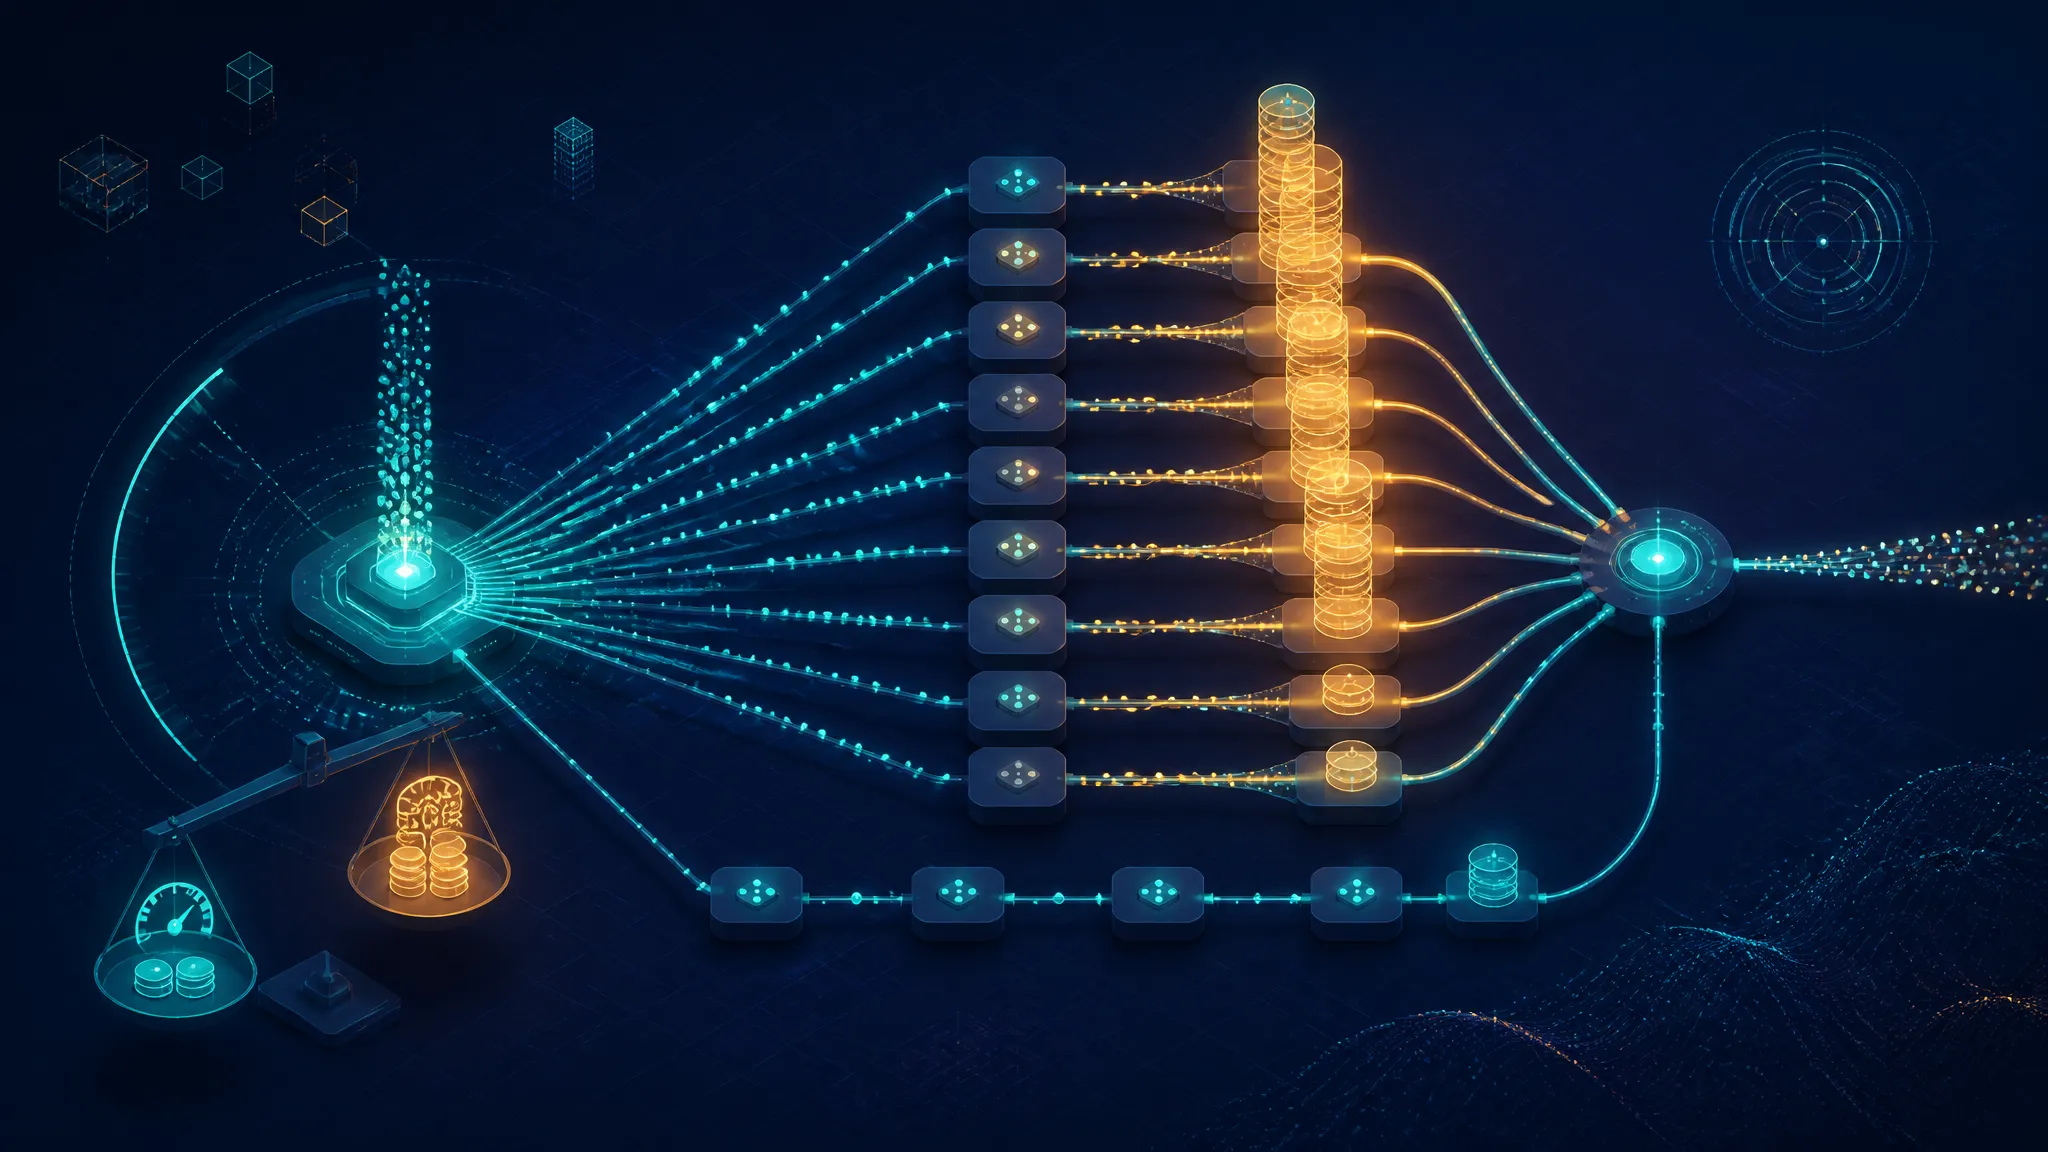
This post shows how to decide whether parallel agent orchestration is actually saving tokens. I'll build a token-cost model for scheduler/worker fan-out, turn it into a Node.js harness you can run against any provider, compare fan-out against a single-agent baseline per accepted task, and call out the cases where parallel orchestration can cost more tokens than it saves. The trigger is DeepSeek's reported Super-Agent architecture, not evidence for its cost profile; the arithmetic and harness are mine.
Two outlets published stories on 2026-11-01 about DeepSeek and a "Super-Agent." I didn't see either of them on a DeepSeek channel — both arrived through Google News aggregation — and that shapes how much weight the rest of this post puts on them.
Two November 2026 reports and nothing else
Confirmed, from the supplied material:
- Startup Fortune, "DeepSeek Open Sources the Architecture Behind Its Super-Agent,"
2026-11-01T00:18:27Z. - Global Times, "DeepSeek unveils 'Super-agent' design to handle multiple tasks in parallel and improve efficiency,"
2026-11-01T04:37:00Z. - Both describe the same thing: an open-sourced architecture behind a DeepSeek "Super-Agent," aimed at running multiple tasks in parallel.
That's the whole confirmed surface. The supplied snippets are headline-level. No repository URL from DeepSeek, no license text, no source files, no model version, no benchmark numbers from either report.
Separating the stated goal from the unstated mechanism
The Global Times headline states a goal: handle multiple tasks in parallel, improve efficiency. "Efficiency" is doing a lot of work in that sentence. In agent systems it means one of three things, and they trade against each other:
| "Efficiency" claim | What it optimises | What it typically costs |
|---|---|---|
| Lower wall-clock latency | Time to first complete answer | More total tokens |
| Lower token spend | Total billed tokens | More coordination turns |
| Lower failure rate | Accepted-task completion | Retries and verifier passes |
Improving one usually worsens another. "Parallel to improve efficiency" — parallel execution is, mechanically, a latency technique. It doesn't reduce the work performed. Nothing in the public reporting says the architecture cuts token consumption, and I want to be explicit that I'm not claiming it does.
Why Parallel Agent Orchestration Is a Latency Lever, Not a Token-Cost Lever
My position: a scheduler/worker fan-out architecture is worth building when you have a wall-clock problem, and it's a mistake to adopt one as a token-cost optimisation. Once you duplicate shared context across n workers and add a coordinator that re-reads their outputs, per-task token cost should rise roughly linearly in n while latency improvement flattens. The rest of the post builds that cost model, ships a harness you can run against your own provider, and shows what the numbers look like.
The DeepSeek announcement is the trigger for this analysis, not the evidence. The architecture claim is theirs; the arithmetic below is mine, and the simulated numbers are clearly labelled as simulated.
Mapping a Scheduler/Worker Split from Headline-Level Detail
I can't describe DeepSeek's actual implementation. What I can do is take the one structural claim in the reporting — multiple tasks handled in parallel — and state what any implementation of that claim has to account for.
What a coordinator/worker topology implies for token accounting
The minimal fan-out topology has three kinds of call:
- A plan call that decomposes the task into slices.
- Worker calls that each handle one slice, typically seeded with the same system prompt, tool schemas, and shared context.
- A synthesis call that merges the worker outputs.
Two mechanical consequences follow immediately, and neither depends on the provider:
- The shared prefix gets duplicated. If the system prompt, tool definitions, and shared task spec total
Ctokens, fan-out tonworkers submits roughlyn × Cshared tokens. The provider may cache them. Caching changes the price, not the duplication. - The coordinator grows. Every merger turn appends worker outputs into the coordinator's context. The coordinator's input at turn
jis proportional to accumulated results so far, so total coordinator input grows faster thann.
None of this is speculation about DeepSeek specifically. It's what "run subtasks in parallel and combine them" costs under any token-billed API.
Where this reading could be wrong
Three implementation choices would weaken the model above, and I can't rule any of them out from the public reporting:
- Shared-context hoisting. If workers get only a small slice-specific prompt and the coordinator holds the shared context, duplication drops to near zero. That's what a well-designed version would do. Whether DeepSeek's does, I don't know.
- No synthesis pass. If worker outputs come back as a structured set instead of being merged by a model, the synthesis term disappears. Works for extraction, fails for anything that needs one coherent answer.
- Deduplication across workers. Some designs share a cached prefix with stable ordering so cache hits land at 100%. That lowers the price of the duplicated
Csubstantially. It doesn't lower the tokens.
All three are open questions, and I'll list them again at the end.
A Token Cost Model for Fan-Out Orchestration
Terms I'll use for the rest of the post:
| Symbol | Meaning |
|---|---|
C | Shared context tokens: system prompt, tool schemas, task spec, retrieved docs |
P_i | Slice-specific prompt tokens for worker i |
P_full | Prompt tokens for the same work done in one sequence |
W_i | Worker output tokens |
S | Synthesis output tokens |
k | Coordinator turns |
n | Fan-out width |
Term 1 — context duplication at fan-out
duplication = n × CA 1,800-token shared prefix at fan-out 8 means 14,400 shared-prefix tokens per task. This term is the single biggest reason parallel runs lose on cost, and it's the easiest to reduce: shrink C, or keep C resident in the coordinator and send workers only P_i.
Term 2 — coordinator turns between worker calls
coordinator = Σ (C_coord + accumulated_j)The accumulated term is the killer. If the coordinator re-reads all worker outputs on every turn, its input is O(k × n × W). With k = 3 merge rounds and n = 8 workers emitting 400 tokens each, that's 9,600 tokens of re-read output.
Term 3 — the synthesis and merge pass
synthesis = (C + Σ W_i) + SSynthesis input scales with total worker output, so it grows linearly in n while usefulness per extra worker drops.
Term 4 — retries, verifier loops, and repair turns
retries = p_fail × (replan_cost + resend_cost)With per-worker failure probability p, expected worker calls are n / (1 - p). At p = 0.1 and n = 8, that's 8.9 calls — modest. The expensive variant is a coordinator re-plan: a failed worker triggers a new plan turn that re-sends C plus every previously collected result. One such event can cost more than the original fan-out.
The full per-task cost expression and what dominates it
Total(n) ≈ Σ_i (C + P_i + W_i) + Σ_j (C_coord + accumulated_j) + (C + Σ W_i) + S + retriesThe break-even condition against a single-agent run is crisp:
Fan-out wins on tokens only if Σ P_i + (n-1)·C + coordinator + synthesis < P_fullIn practice (n - 1)·C dominates, and that's what you should measure first. A 200-token shared context makes fan-out almost free on tokens. A 20,000-token shared context — a repo dump, a long contract, a large tool catalogue — makes fan-out expensive before a single worker runs.
Building a Measurable Harness in Node.js
You can't resolve any of this by argument. You measure it. The harness below is deliberately provider-agnostic, because I don't want to encode assumptions about an SDK I haven't verified.
The numbers later in this post come from the harness's --dry-run meter, which uses fixed per-call token estimates. No API calls were made and no billing was observed. The harness is what makes real measurement possible; the table is arithmetic from the model above.
Instrumenting the client to capture usage per call
Every model call goes through one wrapper. It records usage fields if the provider returns them and zeros if it doesn't. Recording zeros matters — a missing field looks like a free call in aggregate.
const ledger = [];

export function record(entry) {
ledger.push({
  phase: entry.phase,
  workerId: entry.workerId ?? null,
  inputTokens: entry.usage?.inputTokens ?? 0,
  cachedInputTokens: entry.usage?.cachedInputTokens ?? 0,
  outputTokens: entry.usage?.outputTokens ?? 0,
  reasoningTokens: entry.usage?.reasoningTokens ?? 0,
  wallMs: entry.wallMs ?? 0,
});
}

export function totals() {
return ledger.reduce(
  (acc, r) => {
    acc.calls += 1;
    acc.input += r.inputTokens;
    acc.cached += r.cachedInputTokens;
    acc.output += r.outputTokens;
    acc.reasoning += r.reasoningTokens;
    acc.wall += r.wallMs;
    return acc;
  },
  { calls: 0, input: 0, cached: 0, output: 0, reasoning: 0, wall: 0 }
);
}

export function byPhase() {
const out = {};
for (const r of ledger) {
  const k = r.phase;
  out[k] = out[k] || { calls: 0, input: 0, output: 0 };
  out[k].calls += 1;
  out[k].input += r.inputTokens;
  out[k].output += r.outputTokens + r.reasoningTokens;
}
return out;
}
The byPhase() breakdown is what actually answers "where did the tokens go." A single total hides whether you're paying for worker duplication or for a coordinator that re-reads everything.
A single-agent baseline runner
import { record } from "../lib/meter.js";

const MAX_STEPS = 6;

export async function runBaseline(task, callModel) {
const transcript = [];
let answer = null;

for (let step = 0; step < MAX_STEPS; step += 1) {
  const started = Date.now();
  const res = await callModel({
    messages: [
      { role: "system", content: SHARED_CONTEXT },
      { role: "user", content: task },
      ...transcript,
    ],
  });
  record({
    phase: "baseline.step",
    usage: res.usage,
    wallMs: Date.now() - started,
  });

  transcript.push({ role: "assistant", content: res.text });
  if (res.text.includes("FINAL_ANSWER")) {
    answer = res.text;
    break;
  }
}

return answer;
}
Note the accumulating transcript: the baseline isn't free either. Its cost grows because each step re-sends prior assistant turns. That's the same mechanism as the coordinator's growth, which is why comparing fan-out against "one call that does everything" is an unfair baseline.
A parallel orchestrator with a hard fan-out cap
import { record } from "../lib/meter.js";

const FANOUT_CAP = Number(process.env.FANOUT_CAP || 4);

function makeLimiter(cap) {
let active = 0;
const queue = [];
const pump = () => {
  if (active >= cap || queue.length === 0) return;
  active += 1;
  const job = queue.shift();
  job.fn()
    .then(job.resolve, job.reject)
    .finally(() => {
      active -= 1;
      pump();
    });
};
return (fn) =>
  new Promise((resolve, reject) => {
    queue.push({ fn, resolve, reject });
    pump();
  });
}

export async function runFanOut(task, callModel) {
const limit = makeLimiter(FANOUT_CAP);

const planStart = Date.now();
const plan = await callModel({
  messages: [
    { role: "system", content: SHARED_CONTEXT },
    {
      role: "user",
      content:
        "Split this task into at most " + FANOUT_CAP +
        " independent slices. Reply with JSON: {slices:[{id,body}]}.",
    },
    { role: "user", content: task },
  ],
});
record({ phase: "coordinator.plan", usage: plan.usage, wallMs: Date.now() - planStart });

const slices = JSON.parse(extractJson(plan.text)).slices.slice(0, FANOUT_CAP);

const workerResults = await Promise.all(
  slices.map((slice, i) =>
    limit(async () => {
      const started = Date.now();
      const res = await callModel({
        messages: [
          { role: "system", content: SHARED_CONTEXT },
          { role: "user", content: slice.body },
        ],
      });
      record({
        phase: "worker",
        workerId: "w" + i,
        usage: res.usage,
        wallMs: Date.now() - started,
      });
      return { id: slice.id, text: res.text };
    })
  )
);

const merged = workerResults
  .map((r) => "### " + r.id + "\n" + r.text)
  .join("\n\n");

const synStart = Date.now();
const syn = await callModel({
  messages: [
    { role: "system", content: SHARED_CONTEXT },
    { role: "user", content: "Merge these into one answer.\n\n" + merged },
  ],
});
record({ phase: "coordinator.synthesis", usage: syn.usage, wallMs: Date.now() - synStart });

return syn.text;
}
The FANOUT_CAP limiter isn't decoration. Without it you'll hit provider concurrency limits, collect 429s, and silently retry — which inflates the token count in a way you'll misattribute to the model.
Normalizing both into cost per accepted task
Tokens per run isn't the metric. Tokens per accepted task is, because fan-out changes the acceptance rate too.
import { totals, byPhase } from "./meter.js";

// cacheFactor and prices are placeholders: replace with your provider's
// published cache-hit and cache-miss input rates.
export function costPerAccepted(accepted, prices) {
const t = totals();
const billableIn = t.input - t.cached;
const usd =
  (billableIn / 1e6) * prices.inputPerMTok +
  (t.cached / 1e6) * prices.inputPerMTok * prices.cacheFactor +
  ((t.output + t.reasoning) / 1e6) * prices.outputPerMTok;

return {
  calls: t.calls,
  tokensPerAccepted: (t.input + t.output + t.reasoning) / accepted,
  usdPerAccepted: usd / accepted,
  phases: byPhase(),
};
}
Designing the Task Set So the Numbers Mean Something
A harness that runs eight prompts proves nothing. The task set is the experiment.
Three dependency shapes: independent, sequential, shared-state
Stratify your task set by dependency shape — fan-out only helps one of them:
- Independent — "summarise each of these six documents." Workers can't affect each other. Best case, and the only case where fan-out is unambiguously safe.
- Sequential — "parse the invoice, then reconcile against the ledger, then file the discrepancy." Worker 2 needs worker 1's output. Parallelising produces plausible-looking results built on missing inputs, which is worse than a slow correct run.
- Shared-state — "update these six config files." Tasks look independent but write to the same surface. Fan-out produces conflicting writes the synthesis pass can't reconcile.
If your real workload is 80% sequential, a fan-out benchmark built on independent tasks is measuring the wrong thing — and it will flatter the architecture.
Why prompt count is not sample size
Forty tasks across four configurations is 160 runs, but the independent sample is 40 paired observations, not 160. The four configurations share the same 40 prompts, so their results are correlated and should be analysed paired: per task, compare fan-out cost to baseline cost and report the median of the differences. Pooling all 160 runs and reporting a mean treats correlated observations as independent and gives you confidence intervals that are far too narrow.
Choosing an acceptance criterion before the first run
Decide acceptance before you see any output, or you'll rationalise. Reasonable criteria:
| Task type | Criterion | Notes |
|---|---|---|
| Structured extraction | Exact match on every field | No judge, no ambiguity |
| Code change | Test suite passes in a clean container | The tests are the criterion, not a model |
| Free-form analysis | Rubric pass from a fixed judge model | Same judge, same prompt, both arms, blind ordering |
The judge variant is the weakest and should be reported as such. If you use a judge, use one model for both arms and randomise which output it sees first — otherwise position bias becomes your effect size.
Reading the Output: Where the Tokens Went
Illustrative run output and how to read it
$ node bench.js --tasks tasks/independent.json --configs 1,2,4,8 --dry-run

config  tasks  accepted  tok/accepted  p50 wall   p95 wall
1       40     38        12,400        11.8s      14.2s
2       40     38        12,600         8.6s      10.1s
4       40     37        21,300         9.4s      12.9s
8       40     35        45,700        10.6s      17.8s

phase breakdown at fan-out 8:
  coordinator.plan            8% of input
  worker                     67% of input
  coordinator.synthesis      25% of input
Reading it: fan-out 2 is a free latency win — same accepted count, ~27% less wall clock, essentially identical token cost. Fan-out 4 costs 1.7× the tokens of baseline for a latency gain that has already flattened. Fan-out 8 costs 3.7× and is less accurate, because the planner starts inventing slices and the merger starts dropping them.
What the shape of the cost curve tells you at fan-out 1, 2, 4, 8
Two curves diverge, and the divergence is the whole argument:
- Cost is roughly linear in
nabove the crossover, because each extra worker adds a fullC + P + Wround trip. - Latency is sublinear and saturating, because synthesis input grows with
n. Modelling synthesis asa + b·ngives a bounded speedup:
Speedup(n) = n · t_w / (t_plan + t_w + a + b·n) → t_w / b as n → ∞With t_w = 4.0s, a = 2.0s, b = 0.35s, the asymptote is roughly 11×. You approach it somewhere past fan-out 16 while paying 16× the context duplication. That's the trade in one sentence.
Keeping observed results visibly separate from projection
Three categories, never mixed:
- Measured — token counts from your provider's
usagefield, on your tasks, your model version. - Simulated — the
--dry-runtable above. Useful for shaping the harness. Not evidence. - Projected — the
Speedup(n)asymptote. Arithmetic from assumed constants.
The dry-run table has zero standing against anyone's production workload. It has standing only as a sanity check that the harness records what it claims to record.
Cost Accounting Traps That Flatter Parallel Runs
Four ways a parallel benchmark reports better numbers than reality.
Cached input tokens and the illusion of cheap fan-out
Cached input is priced below cache-miss input on most providers, and on at least one major provider cache writes cost more than standard input (Anthropic prompt caching). The trap: a fan-out run with a stable shared prefix reports a high cache-hit ratio and looks cheap, when the first call paid a write premium and the rest only hit because the prefix is byte-identical.
Practical checks: keep per-slice content after the shared prefix so the prefix stays cacheable; compare cache-hit ratios between your fan-out and baseline arms rather than looking at fan-out alone; and price cache reads and writes separately in costPerAccepted. Check your provider's published rates instead of assuming a factor — I use a placeholder in the harness for exactly that reason.
Reasoning tokens hidden in the coordinator
If your provider reports reasoning tokens separately and you only sum outputTokens, coordinator cost disappears from your dashboard. Coordinators plan and merge — reasoning-heavy work. On reasoning models, the coordinator can outspend the workers while staying invisible in a naive output column. Record reasoningTokens as its own field and price it at the output rate.
Tool-result tokens the orchestrator never counts
Tool execution is usually free; the tool output isn't, because it gets re-injected as input on every subsequent turn. In a fan-out design, either each worker keeps its own tool output (cheap, but the coordinator never sees it) or the coordinator collects raw tool results for merging (accurate, but you pay n × tool_tokens at the merger). A worker that reads a 6,000-token file and returns 200 tokens of summary costs 200 output tokens and 6,000 input tokens on its next turn. Benchmarks that count only model calls miss this entirely.
Per-request overhead that only shows up at high fan-out
Each request re-sends tool definitions and response schemas, which are part of C and duplicated n times. On top of that: minimum billable input per request, provider concurrency ceilings that force a limiter, and 429-driven retries. All invisible at fan-out 1, all quadratic-ish in annoyance at fan-out 16. The FANOUT_CAP limiter exists to make this overhead visible and bounded instead of emergent.
The Latency Math: When Fan-Out Actually Pays
Critical path versus total work
Fan-out is a critical-path optimisation. It reduces T, not W.
T_seq   = Σ t_wi
T_fan   = t_plan + max(t_wi) + t_synthesis
Paying for fan-out is worth it when  T_seq - T_fan  >  (extra tokens) × (value of a token)
If your workload is a nightly batch job, T_seq - T_fan is worth roughly nothing and the extra tokens are pure loss. If a user is waiting on a response, the same trade can be obviously correct. The architecture isn't better or worse in the abstract; it's better or worse against a latency budget.
A decision table for split viability
| Workload shape | Fan-out? | Reason |
|---|---|---|
| Independent slices, small shared context | Yes, cap at 3–5 | Duplication cost small, critical path drops |
| Independent slices, 20k+ token shared context | No, unless prefix is cached | n × C dominates before work starts |
| Sequential dependency chain | No | Workers cannot see each other's output |
| Shared mutable state or same files | No, or serialise per key | Write conflicts the merger cannot resolve |
| Interactive latency budget under 5s | Yes | Only lever that helps |
| Overnight batch, cost-sensitive | No | Zero latency benefit, linear cost increase |
| Tool-heavy workers returning large payloads | No, unless results are summarised in-worker | Coordinator pays n × tool_tokens |
Reliability Debt: Partial Failures Multiply Cost
Parallelism turns one failure mode into n independent ones. That's a cost problem before it's a correctness problem.
Retry amplification and idempotency keys
A worker that times out mid-tool-call has to be retried. If the tool had a side effect — a created ticket, a sent email, a written file — the retry duplicates it. Attach an idempotency key derived from (taskId, sliceId, attemptScope), where attemptScope is stable across retries of the same logical slice. If the key changes between attempt 1 and attempt 2, it protects nothing.
The expensive failure isn't the worker retry. It's the re-plan. A coordinator that responds to a failed worker by generating a new plan re-sends C plus everything collected so far — often the single largest line item in a fan-out run.
Budget governors and fail-closed behavior
Two governors, both hard:
const budget = {
  maxTotalTokens: 250_000,
  maxWorkerCalls: 32,
  maxWallMs: 90_000,
};

function assertBudget(totals, calls, elapsedMs) {
  if (totals.input + totals.output + totals.reasoning > budget.maxTotalTokens) {
    throw new Error("token budget exhausted");
  }
  if (calls > budget.maxWorkerCalls) {
    throw new Error("worker call budget exhausted");
  }
  if (elapsedMs > budget.maxWallMs) {
    throw new Error("wall clock budget exhausted");
  }
}
Fail closed: throw, don't return a partial answer with a warning log. A governor that degrades silently hides the exact failure it was built to catch.
Partial-result semantics when one worker times out
Decide this before you ship, because the default Promise.all behaviour — reject everything — is usually wrong for a user-facing system.
| Policy | Behaviour | Cost profile |
|---|---|---|
| All-or-nothing | One worker fails, whole task fails | Cheapest tokens, worst user experience |
| Best-effort merge | Merge available results, mark gaps | One extra synthesis call |
| Explicit gap-fill | Re-run the failed slice serially | Adds serial latency back |
| Degrade to baseline | Abandon fan-out, run single-agent | Most expensive, most reliable |
The reliability win of parallelism is real but narrow: n parallel workers with independent failure probability p have a lower chance of total failure than one long sequential chain of n steps with the same per-step p. The catch: this only holds if you handle partial failure. Otherwise Promise.all collapses the reliability advantage back to the worst-case worker.
Practical Rules I Would Apply Before Shipping
- Measure cost per accepted task, paired by task, against a sequential baseline that also accumulates transcript. A single-call baseline isn't a fair comparison.
- Compute
n × Cbefore writing any orchestration code. If it exceedsP_full, fan-out is costing you before it does anything useful. - Keep the shared prefix byte-identical and put slice content last so it stays cacheable. Verify the cache-hit ratio per arm, not overall.
- Record
reasoningTokensseparately and price it at the output rate. Don't let the coordinator vanish from the dashboard. - Cap fan-out at 3–5 for reasoning models and 8 for cheap extraction. Above that, cost is linear and latency is flat.
- Assume the coordinator is the failure surface. Bound its turn count; every merge round re-reads everything.
- Attach idempotency keys to every side-effecting tool call. Retries are guaranteed; duplicated side effects must not be.
- Fail closed on budget exhaustion. Throw, don't degrade.
- Stratify your task set by dependency shape and report per stratum. A pooled number hides that fan-out won on 20% of tasks and lost on the rest.
What Remains Unverified
Everything about the internal design of DeepSeek's Super-Agent. The public record I have is two headlines from 2026-11-01 and nothing else.
Open questions about the scheduler/worker split
- Is "architecture" code or a design document? Startup Fortune says "open sources the architecture." Without a repository link I can't tell whether that means source code, a paper, or a diagram.
- Where is the code? No URL from DeepSeek appeared in the supplied reporting. I'm not going to guess a repository name.
- Does the coordinator share context with workers, or hold it? That single decision swings token cost by roughly
n×. It's the first thing I'd look for in the source. - Is there a synthesis pass, or are worker outputs returned as a set? Determines whether the
synthesisterm exists at all. - What is the model version and its pricing tier? Token cost comparisons are meaningless without it.
- Is any of this measured, or is "efficiency" a design intention? Neither headline cites a benchmark I can inspect.
Until those are answered, the honest position is: the architecture is interesting as a design pattern, unproven as a cost optimisation, and a reasonable bet as a latency optimisation — with the caveat that you should measure the token delta on your own task set before adopting it. The harness above is the cheapest way to do that.
Further Reading
- Startup Fortune, "DeepSeek Open Sources the Architecture Behind Its Super-Agent" (2026-11-01) — via Google News
- Global Times, "DeepSeek unveils 'Super-agent' design to handle multiple tasks in parallel and improve efficiency" (2026-11-01) — via Google News
- DeepSeek official organisation and repositories — github.com/deepseek-ai (verify anything about the Super-Agent against the actual repo, not against news coverage)
- DeepSeek API documentation — api-docs.deepseek.com (check cache-hit versus cache-miss input pricing before running the cost harness)
- Anthropic, prompt caching documentation — docs.anthropic.com/en/docs/build-with-claude/prompt-caching (documents cache-write pricing above standard input)
- OpenAI, prompt caching guide — platform.openai.com/docs/guides/prompt-caching (prefix-stability requirements for cache hits)
More posts

I Built a Code Agent with DeepSeek V4: Handling 1M Token Context in Practice
A practical guide to building a coding agent using DeepSeek V4's new 1M token context, with real-world performance insights and implementation challenges.

Why the Same Prompt Costs More in Japanese: Tokenizer Variance and Cost Modeling
A deep technical walkthrough of how tokenizer variance across languages inflates LLM inference costs by up to 17x, with concrete mitigation tactics like caching, prompt compression, and language-aware routing.

Three.js r187 and the Tooling Gaps Between Browser 3D and Native Rendering
Three.js r187 narrows key tooling and runtime gaps for browser 3D, but native rendering still leads in asset pipelines, profiling, and production visualization workflows.
Loading comments…