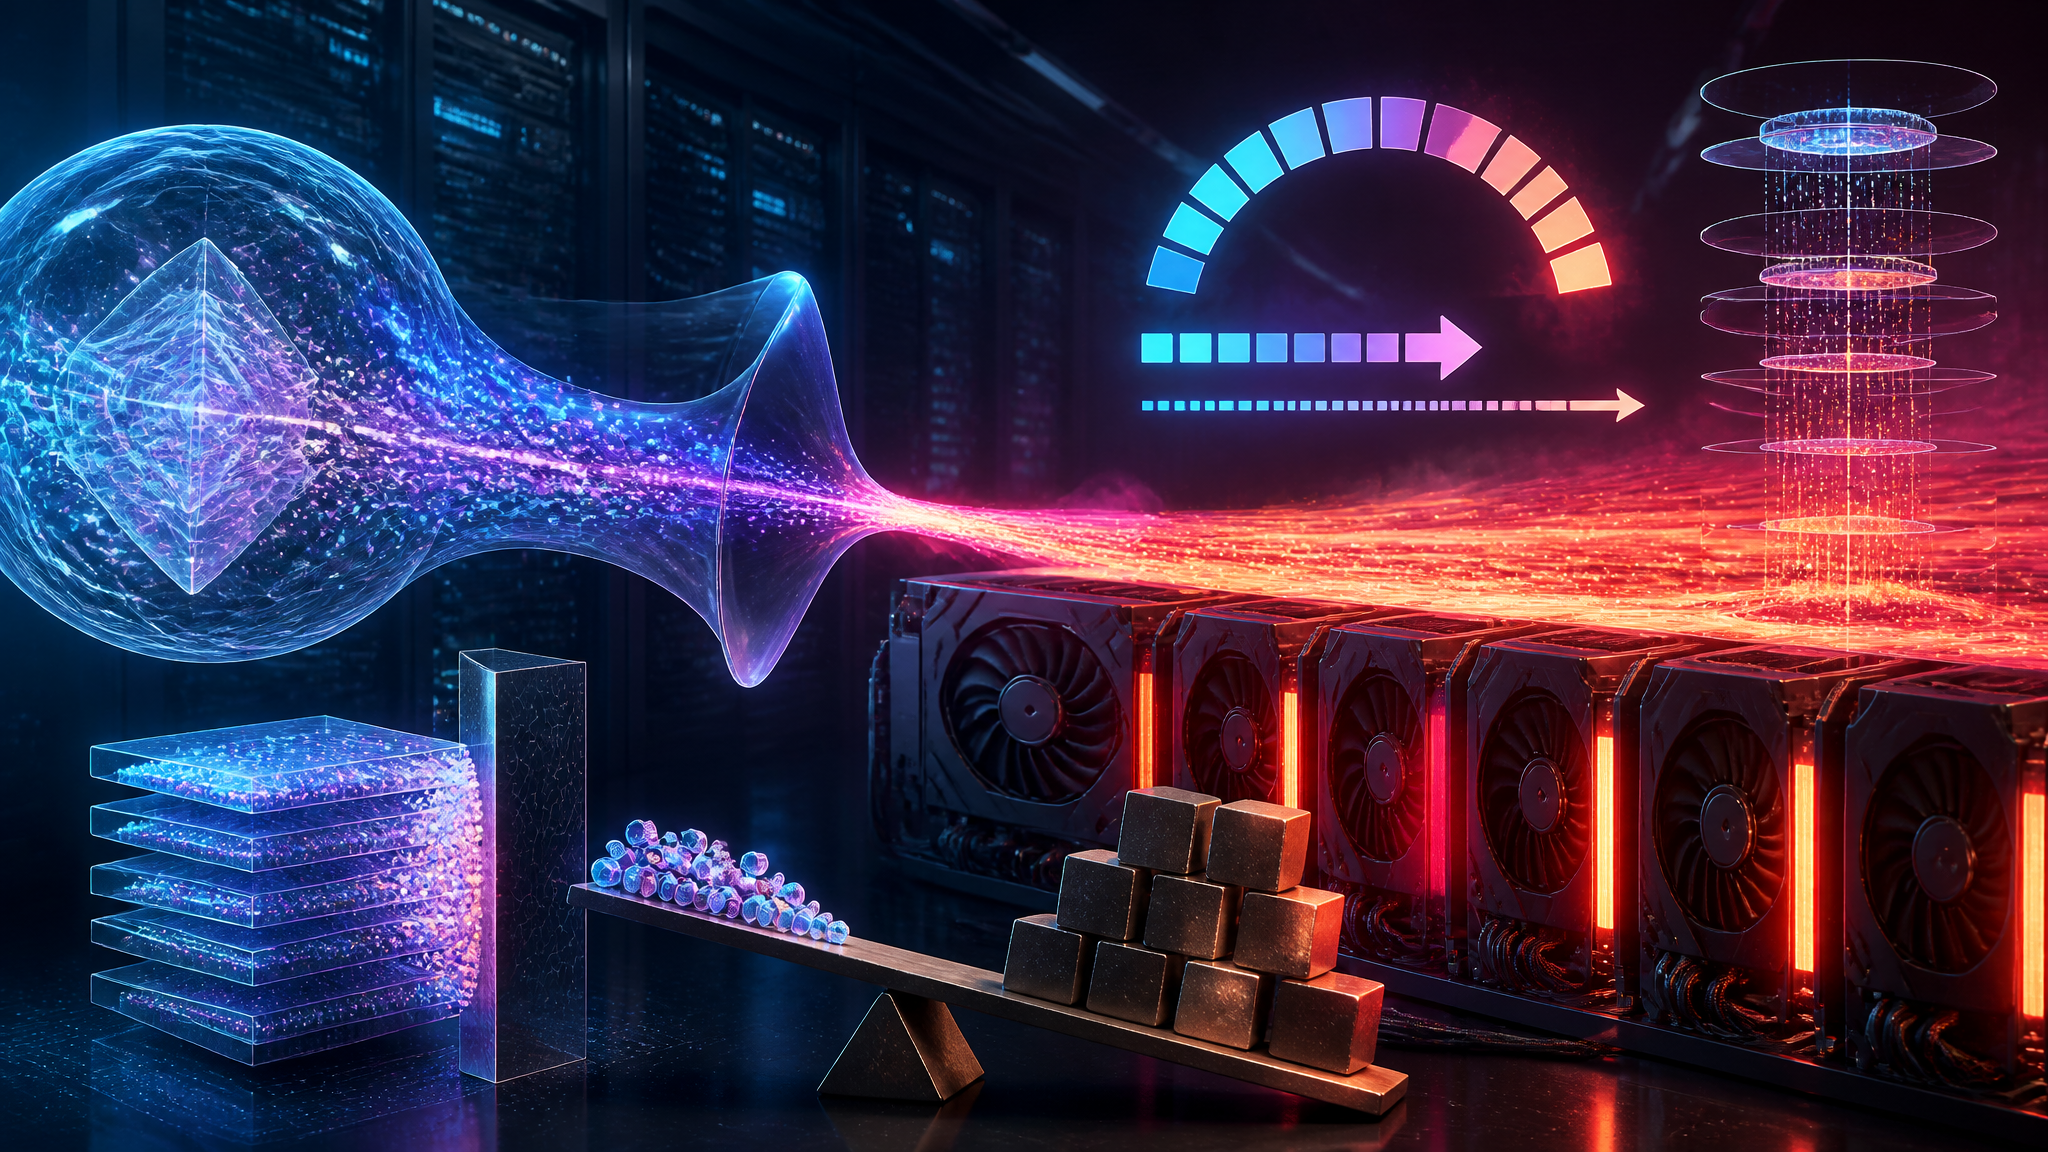
Reflection Beam Throughput and VRAM: What 501B MoE Inference Costs Per Token
Beam, the 501B MoE: VRAM, Throughput, and Cost Per Token
Reflection AI's Beam is a 501B-parameter mixture-of-experts model with only 23B active parameters per token, and those two numbers carry the entire self-hosting cost story. This post works through what a token actually costs in resident VRAM, wall-clock throughput, and dollars per million tokens if you try to host the full 501B yourself for agentic coding workloads.
Coverage dated 2026-10-05 and 2026-10-06 describes Beam as an open-weight MoE tuned for coding and agentic tasks, trained over four weeks on a 10,500-GPU NVIDIA GB300 cluster, with 46.4 million agent sandboxes per day. 23B active sounds like a 23B model. It isn't one, and the distance between those two framings is the whole serving-cost conversation.
Two disclosures up front. I'm working from secondary coverage, not a model card I read myself — I did not download weights, run a benchmark, or open a config.json. And every memory and cost figure below is my own arithmetic from the stated 501B count, not a vendor number. Where I'm inferring rather than repeating what a source said, I mark it.
What the Beam Release Claims, and What I Could Actually Verify
Confirmed from the provided coverage (secondary sources, not a model card):
- 501B total parameters, 23B active per token, sparse MoE
- Open weights
- Tuned for coding and agentic workloads
- Trained on a 10,500-GPU NVIDIA GB300 cluster over four weeks, with 46.4M agent sandboxes per day
- Coverage states Beam trails leading open models on coding tests while claiming substantially lower inference compute
Not verified by me, and not present in the source material:
- The exact benchmark set, harness, and scores behind the coding comparisons
- The serving configuration behind the "lower inference compute" claim — precision, batch size, context length, tensor-parallel degree, hardware
- License terms and whether commercial use is permitted
- Quantization support and published quality-retention numbers
- Whether weights were actually downloadable at the time of writing
The 10,500-GPU and 46.4M-sandbox figures come from wccftech and the MarkTechPost summary, not a primary artifact. I didn't reproduce them and I can't audit them from here. Treat them as reported training-stack details, which is a different epistemic category from a serving benchmark.
Active Parameters Are Not a Token Cost
A sparse MoE routes each token to a top-k subset of experts. FLOPs per token scale with the active parameters. Resident memory scales with total parameters, because the router can select any expert for any token, so every expert weight has to be addressable at inference time.
That asymmetry isn't a footnote. It means a 501B/23B model is interchangeable with a dense 23B model at exactly one layer of the stack — the matmul FLOP count — and nowhere else. Not in weight storage, not in checkpoint size, not in load time, not in the interconnect topology you need, not in the memory-bandwidth profile of decode.
Why 23B Dense and 501B/23B Sparse Look Nothing Alike in Memory
Run the arithmetic at BF16 (2 bytes per parameter):
Dense 23B,  BF16:  23e9  × 2 bytes =  46 GB of weights
Sparse 501B, BF16: 501e9 × 2 bytes = 1,002 GB of weights
Roughly 22× the memory for the same per-token FLOP budget. Both numbers are my arithmetic from the stated parameter counts.
A 46 GB dense model fits on two 48 GB cards, or one 80 GB card with room to spare. A 1 TB sparse model doesn't fit near a single node without quantization and careful sharding. Same active-parameter headline, completely different deployment story.
Router, Expert Parallelism, and the Interconnect Bill
Serving a large sparse MoE is partly an interconnect problem. Experts get sharded across GPUs (expert parallelism, often combined with tensor parallelism inside each expert). Each token's hidden state is all-to-all routed to whichever devices own its selected experts, processed, and routed back. At low batch size those are small payloads chasing high latencies, and the communication-to-compute ratio goes bad fast.
This part is inference, not a measured result: I suspect it's the main reason a low-FLOPs-per-token model can still be expensive per token. The active-parameter ratio hides the routing tax, and the routing tax is what shows up as inter-token latency in an interactive session.
The VRAM Math for a 501B Model, With Assumptions on the Label
All figures in decimal GB (10⁹ bytes), which is how accelerator capacity is marketed. Capacities are the approximate class figures from public vendor documentation: H200-class ~141 GB, B200-class ~192 GB, GB300-class ~288 GB.
| Precision | Bytes/param | Weights | Min H200-class (141 GB) | Min B200-class (192 GB) | Min GB300-class (288 GB) |
|---|---|---|---|---|---|
| BF16 | 2 | ~1,002 GB | 8 | 6 | 4 |
| FP8 | 1 | ~501 GB | 4 | 3 | 2 |
| 4-bit | 0.5 | ~251 GB | 2 | 2 | 1 |
Every weight figure is my arithmetic from 501B parameters. Every GPU count is ceil(weights / capacity) and is a floor for weights alone — zero room for KV cache, activation workspace, communication buffers, or framework overhead. In practice you want 15–25% headroom on top, and a disaggregated prefill/decode deployment needs separate budgets per role.
Second caveat: quantizing a sparsely-routed MoE is harder than quantizing a dense model. Routing decisions are discrete top-k selections, and weight perturbation near a routing boundary can flip which expert a token lands on, changing the output in ways a perplexity number won't reveal. A 4-bit checkpoint at ~251 GB is therefore not automatically a 4-bit deployment — the quality question is separate and, for Beam specifically, unanswered in the material I have.
KV Cache and Context Length Are the Second-Order Cost
Agentic coding pushes long contexts: repository files, tool output, multi-turn state. KV cache is per-sequence and grows linearly with tokens.
KV bytes = 2 × tokens × layers × kv_heads × head_dim × dtype_bytes
           ^
           K and V
Worked example using placeholder constants — I didn't have Beam's layer count or head configuration at the time of writing, so this is illustrative, not Beam's numbers:
tokens     = 100,000
layers     = 64
kv_heads   = 8        (grouped-query attention)
head_dim   = 128
dtype      = FP8 (1 byte)

KV bytes = 2 × 100,000 × 64 × 8 × 128 × 1
         = 13,107,200,000 bytes
         ≈ 13.1 GB per sequence
13 GB is manageable. Now remove the GQA assumption — if kv_heads equals the attention head count, say 128 instead of 8, the same math gives ~209 GB per sequence. That single config field decides whether a 100K-context agent session is a rounding error or the dominant memory term. It's the first thing I'd check.
Where Beam's Throughput Claim Actually Lands
Prefill and decode have different bottlenecks, and the active-parameter advantage only cleanly helps one of them.
Prefill processes the whole prompt in parallel and is largely compute-bound, so low FLOPs per token translates into real prefill speedups. A 501B/23B model can genuinely look efficient here.
Decode generates one token at a time and is memory-bandwidth-bound. At batch size 1 the model must read the active weights for each token — and at long context, the entire KV cache as well. The FLOP advantage shrinks toward irrelevance; what dominates is bytes moved per token divided by achievable bandwidth.
At ~100K context with the placeholder KV numbers above, the per-decode-step read splits roughly between active weights and KV cache. That mechanically reframes the claim. Lower FLOPs per token does not imply lower latency per token. "Lower inference compute" is a FLOPs claim, and at high concurrency a throughput claim. Batch-1 latency is a different quantity, and I found no published figure for it at realistic context lengths.
The Hard Case Is One Agent, Not a Batch
Batching amortizes MoE serving cost: routing overhead, weight streaming, and communication all get shared across sequences. Aggregate tokens/sec at concurrency 64 can look great.
An interactive coding agent is the opposite shape — one session, long context, many short calls, a human waiting. That's batch size 1, the least favorable case for a sparse MoE. My reading of the workload shape, not a measured result.
For HackyJS readers building agents, the numbers that matter are time-to-first-token and inter-token latency at batch 1 with your real context length. Aggregate tokens/sec at high concurrency is a datacenter metric and tells you almost nothing about whether an agent feels responsive.
A Rough Cost Model for Self-Hosted Beam Inference
Every input here is a placeholder you have to replace. I'm picking round numbers to show the division, not to publish a price.
Assumed GPU-hour rate (H200-class, rented):  $3.00
GPUs needed (FP8 weights + KV headroom):     8
Hourly cost:                                 8 × $3.00 = $24.00

Assumed decode throughput, batch 1, ~16K ctx: 25 tokens/sec
Tokens per hour:                              25 × 3600 = 90,000

Cost per million tokens = $24.00 / (90,000 / 1,000,000)
                        = $24.00 / 0.09
                        ≈ $267 per million tokens
Change one input and the answer moves a lot. At 10 tokens/sec you get roughly $667/M. At 50 tokens/sec, roughly $133/M. So the honest output is an order-of-magnitude range of $100–$700 per million output tokens at batch 1 — with the caveat that the tokens/sec placeholder is entirely unverified for this model.
Now amortize. If sustained batching gets you 600 tokens/sec, the same $24/hour yields ~$11 per million tokens. That's the whole story in one line: utilization dominates everything else. A provider renting the same hardware across many customers will beat a self-hosted single-node deployment on cost until your utilization is high and sustained.
Is Beam a Practical Self-Hosting Target?
My position: for a team with one 8-GPU node, the full 501B is not a self-hosting target, however attractive the 23B active ratio sounds. BF16 weights alone need ~1,002 GB, which exceeds an 8×141 GB node before a single KV byte is allocated. FP8 fits the weights in 4 H200-class cards and then has to survive KV cache at your context length.
| Constraint | Verdict |
|---|---|
| One 8-GPU node, BF16, want simplicity | Not viable — weights alone don't fit |
| 8×H200/B200, FP8, short context (≤16K) | Possible but tight; measure batch-1 latency first |
| 100K-context agent sessions, batch 1, interactive | Rent it — self-hosting economics don't close |
| Privacy mandates on-prem inference | Use a smaller dense open-weight coder (20–35B class) |
| Sustained high-concurrency batch workload | Self-hosting becomes defensible; recompute per-million cost |
The practical options are provider API access, a smaller open-weight coder, or waiting for a credible quantized release with measured quality retention. The third isn't passive — a published 4-bit checkpoint with routing-sensitivity evals would change the table above materially.
What to Measure Before You Commit to Self-Hosting Beam
Don't trust the headline parameter count. Read the config.
const cfg = JSON.parse(await readFile("./beam/config.json", "utf8"));

const {
  num_hidden_layers: layers,
  num_local_experts: experts,
  num_experts_per_tok: topK,
  hidden_size: hidden,
  intermediate_size: ffn,
  num_attention_heads: heads,
  num_key_value_heads: kvHeads,
} = cfg;

// Gated MLP per expert: gate_proj + up_proj + down_proj
const perExpert = 3 * hidden * ffn;
const expertParams = layers * experts * perExpert;

// Attention block: q, k, v, o (approximate)
const kvDim = kvHeads * (hidden / heads);
const attnParams = layers * (hidden * hidden + hidden * kvDim * 2 + hidden * hidden);

const total = expertParams + attnParams;
console.log({
  layers, experts, topK,
  activeExpertFraction: `${((topK / experts) * 100).toFixed(2)}%`,
  totalB: (total / 1e9).toFixed(1),
  weightsGB_BF16: (total * 2 / 1e9).toFixed(0),
  weightsGB_FP8: (total * 1 / 1e9).toFixed(0),
  kvGB_per100k_FP8: (2 * 100000 * layers * kvHeads * (hidden / heads) / 1e9).toFixed(1),
});
The output shape looks like this — again, placeholders, since I never had Beam's config file:
{
  layers: 64,
  experts: 256,
  topK: 8,
  activeExpertFraction: '3.13%',
  totalB: '498.7',
  weightsGB_BF16: '997',
  weightsGB_FP8: '499',
  kvGB_per100k_FP8: '13.1'
}
Then measure latency instead of guessing it. A minimal streaming harness:
const t0 = performance.now();
const res = await fetch(endpoint, {
  method: "POST",
  headers: { "content-type": "application/json", authorization: `Bearer ${key}` },
  body: JSON.stringify({ model, messages, stream: true, max_tokens: 256 }),
});

let first = null, tokens = 0, last = t0;
const reader = res.body.getReader();
const dec = new TextDecoder();

while (true) {
  const { value, done } = await reader.read();
  if (done) break;
  for (const line of dec.decode(value).split("\n")) {
    if (!line.startsWith("data: ") || line.includes("[DONE]")) continue;
    const chunk = JSON.parse(line.slice(6));
    if (chunk.choices?.[0]?.delta?.content) {
      if (first === null) first = performance.now();
      tokens++; last = performance.now();
    }
  }
}

console.log({
  ttft_ms: first - t0,
  tokens,
  interToken_ms: tokens > 1 ? (last - first) / (tokens - 1) : null,
});
Run that at your real prompt shape, batch 1, your actual context length. Not a 200-token "hello."
Sanity Checks That Catch Bad Serving Settings
The cheap failure modes, roughly in order of how often they bite:
- Expert offloading to host RAM. If experts spill to system memory, every routed token takes a PCIe hop. Throughput can drop by an order of magnitude, and nothing in the startup logs says "you are now benchmarking your motherboard."
- Tensor-parallel degree that doesn't divide the expert count. Uneven shards leave capacity idle and add a straggler on every all-to-all. Check divisibility before you rent the node.
- Quantized checkpoints that degrade routing. Boundary-flipping in top-k selection will not surface on a five-prompt smoke test.
For quality, run a task-specific eval with a stated criterion and count rather than trusting a leaderboard:
Task:      fill 12 function stubs from a repo's existing style and tests.
Criterion: stub compiles and its unit tests pass, no manual edits.
Count:     20 prompts.
Result:    __/20 pass, with the failures listed by category.
That format forces you to report failures instead of an average. It takes an afternoon and it's the only number that maps to whether the model works for your codebase.
Conclusion
Reflection AI's Beam is a real compute story on paper: 23B FLOPs per token against a 501B parameter pool is genuinely efficient in the prefill-bound regime. But VRAM is set by the 501B total, decode latency at batch 1 is set by memory bandwidth and routing overhead, and the workload readers actually care about — one long-context coding agent — is the least favorable case for a sparse MoE.
Three things would change that verdict: a verified quantization path with published quality retention on realistic task evals, batch-1 latency numbers at realistic context lengths, and per-token pricing that undercuts a comparable dense model. Until those exist, treat the inference-efficiency claim as a hypothesis about aggregate throughput, not a promise about your agent's responsiveness.
Further Reading
All four of these are news coverage, not primary artifacts. I haven't independently verified their contents beyond what's summarized above.
- Reflection AI Introduces Beam: A 501B Open-Weight MoE Model With 23B Active Parameters for Coding and Agentic Workloads — MarkTechPost release write-up
- Reflection's Beam trails top open models on coding tests but claims lower inference compute — Help Net Security report on benchmark and inference-compute claims
- NVIDIA-Backed Reflection Used 10,500x GB300 GPUs And 46.4 Million Sandboxes Per Day For 4 Weeks To Train Beam — wccftech on the training cluster and sandbox volume
- Reflection AI Unveils Beam, a 501B-Parameter Open-Weight Model — unite.ai announcement item
The primary artifacts to check before trusting any of the above are the model card, the license, and the published config.json. None were present in the source material I was given, so I didn't verify links to them — read the config yourself and redo the arithmetic with the real layer count, expert count, top-k, and KV head count rather than relying on headlines about active parameters.