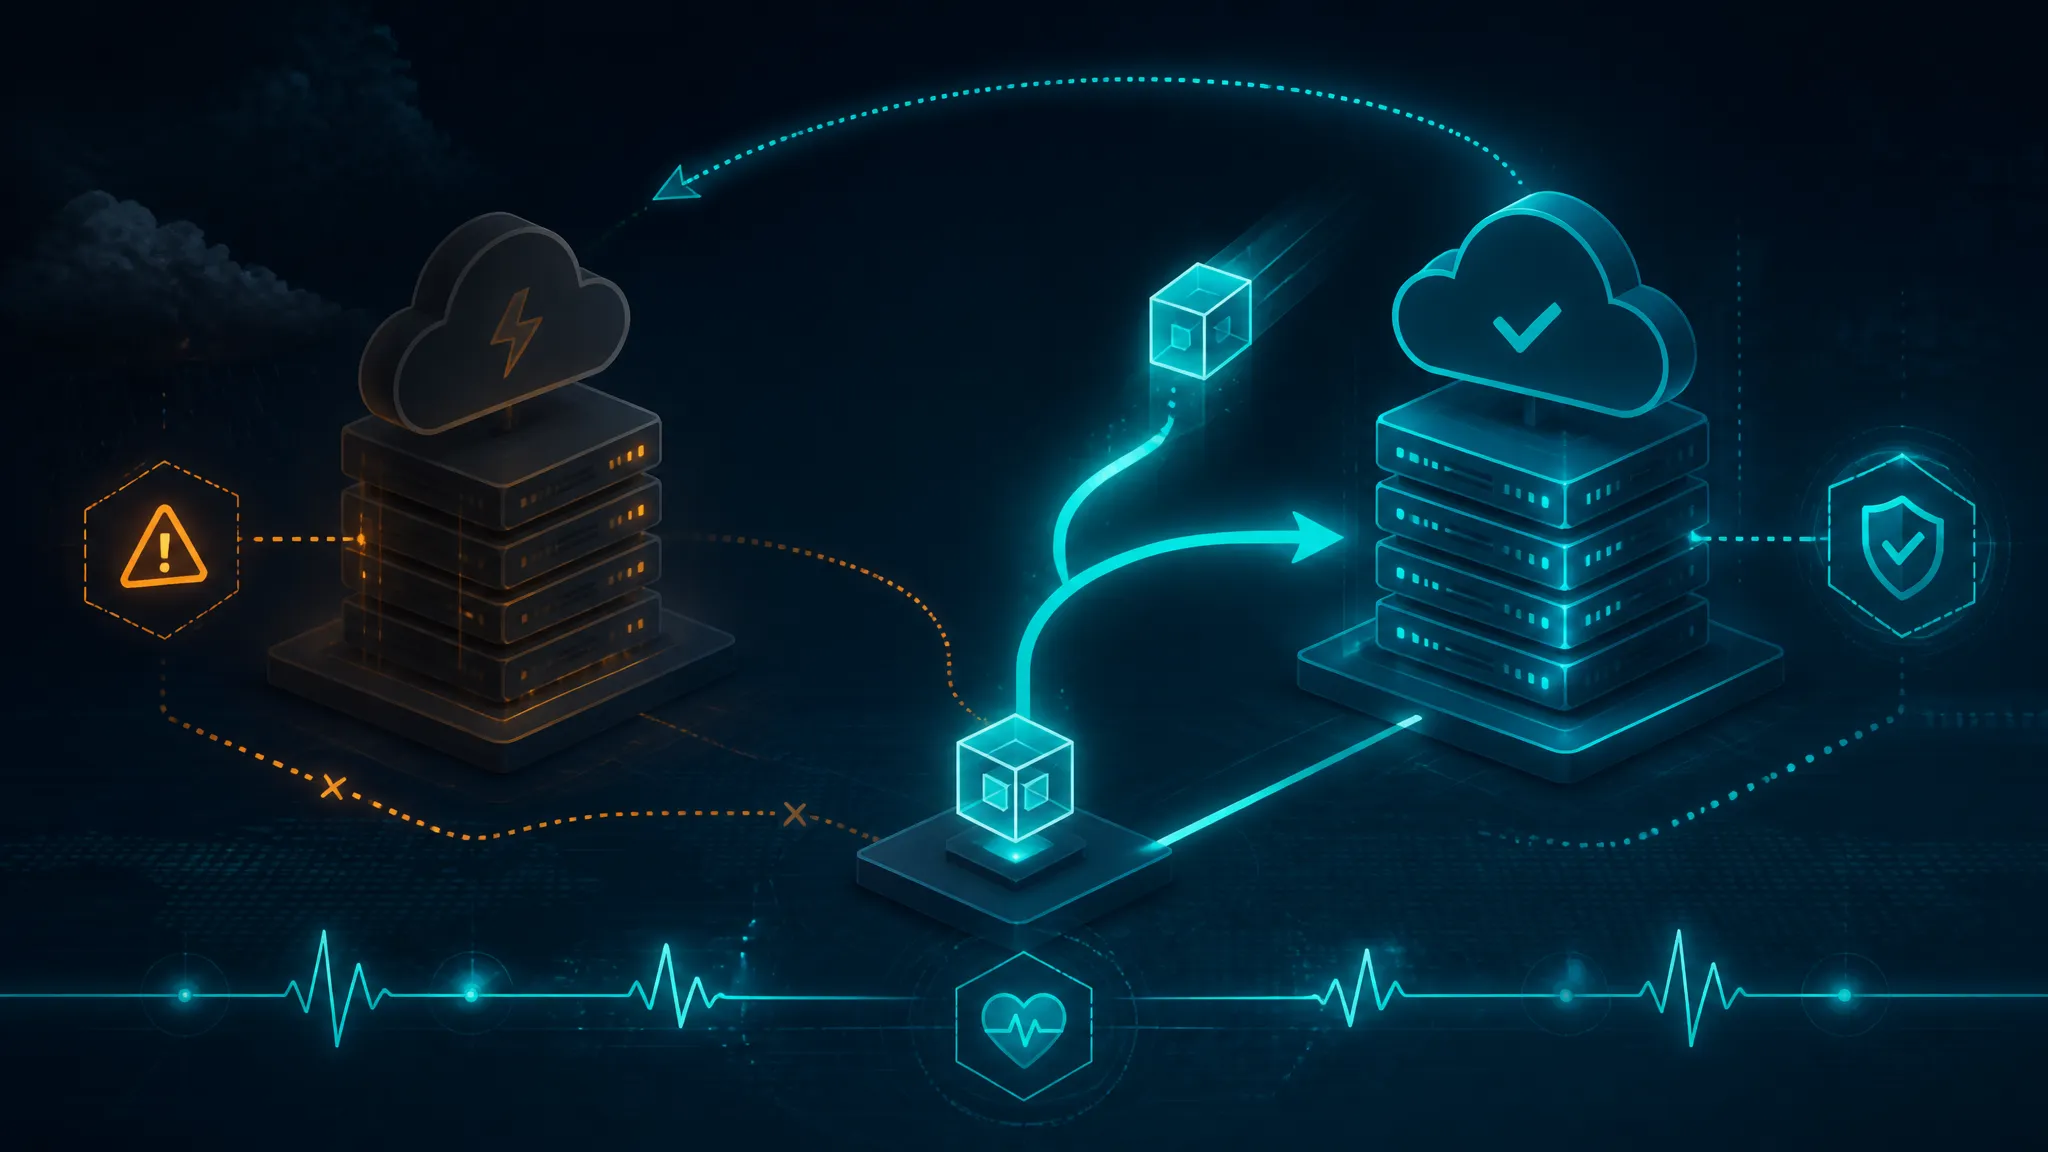
Designing a Tested Failover Path for JavaScript Deploys When Vercel Goes Down
On this page
Introduction: An Outage You Didn't Cause but Still Have to Answer For
On 5 November 2026, two unrelated infrastructure failures landed in the same news cycle. Users reported that Vercel's website, dashboard, login, deployment pipeline, hosting, and API were all affected. Separately, The Register reported that a Google datacenter in London lost power and the backup generators never took the load. This post is about the part you can control: designing and testing a failover path for JavaScript deploys when Vercel goes down.
Neither incident is your fault. Both are your problem.
Here's the position this post takes: for most JavaScript teams the second deployment target is not the deliverable — the portable build artifact is. A standby environment you can't build reproducibly is a rumor. A DNS switch you've never flipped is a hypothesis. A rollback you've only read about in a runbook is a plan to improvise under pressure.
The walkthrough covers what the two reports actually establish, how to classify your workload by portability, how to produce an artifact that ships to a second target without forking, how to make DNS the switch, and how to rehearse the whole path on a schedule instead of during an incident. The code is the shape I'd expect a team to commit on a Monday, not a finished platform.
What the Vercel and Google Outage Reports Establish — and What They Don't
What the Vercel Disruption Report Confirms
The only reporting in hand is a user-report aggregation published by The Sunday Guardian on 5 November 2026, drawn from outage-tracker signal. It states that users reported problems with the Vercel website, dashboard, login, deployment, hosting, and API access.
That is where the evidence stops. It is not a vendor postmortem. It names no root cause, no start or end time, no region, no error signature. Nothing in it separates "the dashboard is slow" from "customer production traffic is returning 5xx," and for you those are very different incidents.
Established: a multi-surface disruption on that date, with user reports spanning both control-plane surfaces (dashboard, login, deploy) and data-plane surfaces (hosting, API). Inference, not established: that the deploy pipeline and the request-serving path shared a failing dependency. Login and deploys failing together usually points at an auth or control-plane dependency — but users routinely conflate "I can't log in to check my site" with "my site is down." The aggregation tells you nothing reliable about your own traffic path.
What the Google London Datacenter Report Confirms
The Register's 5 November 2026 report describes a power loss at a Google datacenter in London where the expected generator takeover did not happen. The power loss isn't the interesting part; datacenters lose power. The transfer is. Generators are cheap insurance — the automatic transfer switch and the load sequence behind it are the actual engineering. A generator that starts but doesn't carry load, or a switch that doesn't close, produces the same outcome as no generator at all.
The report confirms a power event and that backup generation did not pick up as designed. It does not confirm the specific failure mode, the duration, the affected services, whether the transfer switch or the generator start sequence failed, or whether any SLA credits followed. If you need those details, wait for the official incident report rather than inferring them.
Separating Confirmed Facts from Inference in Both Stories
The two stories rhyme, and that rhyme is the useful part:
| Claim | Status |
|---|---|
| Vercel had user-reported disruptions across dashboard, login, deploy, hosting, and API on 5 Nov 2026 | Reported by a secondary source aggregating user reports |
| Vercel's root cause for that disruption | Unknown in the provided material |
| Google's London datacenter lost power and generators did not take over | Reported by The Register |
| The exact failed component (switch vs. generator) | Unknown in the provided material |
| Untested redundancy is equivalent to no redundancy | Inference from general engineering practice, not a claim about either incident |
Hold that last row as a thesis if you like — it's a general statement about systems, not an accusation about anyone's particular Tuesday.
Why Redundancy Without a Tested Failover Path Isn't a Strategy
Redundancy you have never failed over to is a hypothesis
A standby that has never served production traffic has unknown behavior in exactly the dimensions that matter: cold-start latency at your real request rate, connection pool exhaustion, cache population, secret availability, and whether your build even reproduces on a machine that isn't the primary's builder.
Google's London event is that failure in physical form. The redundancy existed. The hardware was installed. Somebody signed the contract. The transition is what didn't happen. Software lets you test the transition for pocket change. Most teams don't, because the test is scheduled and the outage isn't.
Mapping shared dependencies: DNS, build, artifact store, auth, CDN
Draw the dependency graph before the failover diagram. Every "two providers" architecture has hidden single points, and they usually live in this list:
- DNS: both targets sit behind one registrar and one DNS provider. If the failover mechanism is DNS, DNS is now your single point of failure.
- Build: if the standby is built on demand by a different pipeline on a different Node version, you have two products, not two targets.
- Artifact store: if the artifact lives only in the primary provider's build cache, you can't promote it anywhere while that provider is down.
- Auth: your IdP or the platform's. If sessions are issued by the platform and validated by middleware you don't control, failover logs everyone out at the worst possible moment.
- CDN: if the CDN's origin config is owned by the primary platform, flipping DNS may just point traffic at an edge that still calls a dead origin.
One artifact store, shared by both deploy jobs, backed by an object bucket neither platform owns, collapses three of those five risks for the price of a bucket.
Control plane versus data plane, and which one usually breaks
Keep these separate in your head and in your runbook:
- Control plane: git-triggered builds, deploy APIs, dashboard, login, environment variable management, domain configuration.
- Data plane: serving requests to real users.
The Vercel report covers complaints about both surfaces, which is what makes it a good example of a bad incident shape. If only the control plane breaks, your product keeps serving and you just can't ship. If the data plane breaks, you have minutes.
Practically: your failover trigger has to key off data-plane evidence. "The deploy API is returning 500" is not a reason to move DNS. "Synthetic checkout is failing from three regions for four minutes" is.
Defining the Failover Contract Before Choosing Any Vendor
What "down" means for your product: deploy-time, runtime, or dashboard-only
Write three separate conditions with three separate responses:
- Dashboard-only: no failover. You lose visibility and shipping ability. Response: wait, or promote from CI. This is a Tuesday.
- Deploy-time: builds fail or the deploy API rejects. You cannot ship a fix. Response: if you have a prebuilt artifact in your own bucket, deploy it to the standby. If not, you're waiting. This is why the artifact store matters more than the second vendor.
- Runtime: production traffic is failing. Response: switch DNS, on-call authority, incident channel. The only condition that justifies the expensive runbook.
Teams that never write this down end up switching DNS because the dashboard is down, converting a minor control-plane incident into a self-inflicted data-plane one.
RTO and RPO for a static site versus an SSR app
RTO (time to restore) and RPO (tolerable data loss) differ by workload class more than most estimates admit:
| Workload | Realistic RTO with tested path | RPO concern |
|---|---|---|
| Static export on object storage + CDN | 5–15 min (DNS TTL bound) | None for code; content depends on CMS |
| SSR on a container target, warm | 10–30 min (DNS TTL + capacity headroom) | Writes to primary-only DB |
| SSR with platform KV/cache | 30–90 min (needs substitute services) | Cache is rebuildable; writes are not |
| Edge middleware in production path | Hours (needs reimplementation) | Not applicable |
Those are estimates from the shape of the dependency graph, not measurements from either incident. Measure your own — the tests later in this post exist to replace the guesses with a number you can put on a slide.
Deciding what degrades gracefully and what must hard-fail
Not everything deserves to survive. Decide explicitly:
- Degrade: search, recommendations, personalized content, analytics, image optimization (serve originals), non-critical middleware.
- Hard-fail with a clear error: authentication, checkout, anything touching money or personal data — as long as the error is honest and the fallback isn't a silent wrong answer.
A standby that quietly serves stale prices because the pricing service didn't come along is worse than a 503. Put the degradation table in the app, not the runbook, so code review enforces it.
Classifying Your Workload by Portability
Tier 1: static output and prebuilt assets
If npm run build produces a directory of static files, you're in the best tier and probably don't know it. That directory goes to S3, R2, GCS, nginx on a VM, or a second static host. There is no runtime contract beyond "serve these bytes with the right headers."
The work is: correct Content-Type, sane Cache-Control, an SPA fallback rule if you need one, TLS at the CDN. A break-glass static tier for a Tier 1 app is an afternoon, not a project.
Tier 2: SSR, ISR, and edge middleware
SSR means the artifact now includes a server, and portability becomes "what does that server need at runtime": a Node version, a filesystem for the build output, env vars. Containerizing the server output makes it portable to any container host.
ISR is where it gets expensive. Incremental regeneration depends on a cache store and a revalidation trigger that the framework wires to a specific platform. Porting it usually becomes "rebuild on a schedule and serve with CDN stale-while-revalidate" — a behavior change, not a config change.
Edge middleware is the worst case because it may not be Node at all. Runtime-specific edge APIs don't port to a container, and container-based middleware adds a network hop. Budget for rewriting it in-app rather than shimming it.
Platform primitives that do not port: image optimization, KV, cron, edge config, preview comments
Each of these is a runtime dependency on someone else's control plane:
- Image optimization: on-demand resizing endpoints. Portable substitute: build-time variants plus CDN resizing, or ship
unoptimizedduring failover and eat the bytes. - KV / Edge Config: fast reads wired into the framework's request path. Substitute: Redis or Postgres behind your own interface with a fallback read path.
- Cron: a platform scheduler calling a route. Substitute: any external scheduler with a shared secret.
- Edge config / flags: replace with env-manifest-driven flags so behavior is identical on both targets.
- Preview comments: browser-side UI injection. Not worth porting; comment on the PR from CI instead.
The pattern holds: anything that changes at request time via a provider API is a portability liability. Anything baked at build time is free.
Portability Ratings and Workarounds by Feature
| Feature | Portability | Workaround |
|---|---|---|
Static export (out/) | High | Ship to any object store + CDN |
| SSR pages | Medium | Container target running the framework's Node server output |
| ISR / revalidation | Low | Scheduled rebuild or CDN stale-while-revalidate |
| Edge middleware | Low | Move checks into the app; accept one extra hop |
| On-demand image optimization | Medium | Build-time variants, or serve originals during failover |
| KV / Edge Config | Low | Own Redis/Postgres behind an interface |
| Platform cron | Low | External scheduler with a shared secret |
| Platform blob storage | Medium-high | S3-compatible client, bucket per environment |
| Platform auth / session | Low | Your own session cookie minted by your app |
| Preview comments | None | Drop it; use PR comments |
Anything rated Low should be treated as "does not exist during failover." If the app can't boot without it, the failover plan is fiction.
Building a Portable Build Artifact
Pinning the Node version, package manager, and lockfile in CI
Three files, checked in, non-negotiable:
.nvmrc          # 20.11.1
package.json    # "packageManager": "[email protected]"
package-lock.json
CI reads the version from the file instead of a hardcoded matrix value, and the local shell does the same. A standby building on Node 22 while the primary builds on Node 20 isn't a standby; it's a second product with a different baseline. The release schedule lives at nodejs/Release, which is also the page to cite when someone asks why the odd-numbered major isn't in production.
Framework adapter output versus platform-agnostic output
Two shapes, and you should produce both from one build where possible:
- Platform adapter output: whatever the primary deploy consumes — its build output spec, its serverless function format, its routing manifest.
- Platform-agnostic output: a static directory and/or a container image running the framework's own Node server.
The check that keeps them honest: the platform-agnostic output must be sufficient to serve the app. If it isn't, the adapter is doing request-time work you haven't accounted for, and that work will break on the second target.
Turning environment variables into a checked build-time manifest
Stop treating env vars as ambient truth. Emit a manifest at build time that declares them:
{
"commit": "a91c4f2e8b31",
"runtime": { "node": "20.11.1", "packageManager": "[email protected]" },
"primaryHost": "primary-app.example.com",
"env": {
  "buildRequired": ["NEXT_PUBLIC_API_URL", "NEXT_PUBLIC_SITE_ORIGIN"],
  "runtimeRequired": ["DATABASE_URL", "SESSION_SECRET", "REDIS_URL"],
  "runtimeOptional": ["SENTRY_DSN"]
},
"publicOrigins": ["https://primary-app.example.com", "https://standby.example.net"]
}
Names only, never values — plus, if you want drift detection, a short hash of each value so two targets can be compared without ever printing a secret.
Absolute URLs, cookie domains, and host-header assumptions that break on a new origin
This is the bug class that makes a failover "work" and still log everyone out:
- Absolute URLs in build output: an OpenGraph URL or canonical link baked to the primary host. Cosmetic until it becomes a redirect loop or a broken share card.
- Cookie domain: a cookie scoped to
app.example.comis present on both targets. A cookie scoped toprimary-app.vercel.appis not, and that's a session wipe. - Host-header assumptions: webhook signature verification, OAuth callback URLs, CSRF origin checks comparing against a hardcoded host. On the standby the origin differs and every POST fails.
Fix pattern: derive the origin from a single SITE_ORIGIN env var validated against publicOrigins in the manifest, and make CSRF checks compare against a list rather than a closure over one string.
A CI Step That Validates the Artifact Before It Ships Anywhere
This script earns its keep more than anything else here. It fails the build, not the incident.
import { readFile } from "node:fs/promises";


const problems = [];
const manifest = JSON.parse(await readFile("build-manifest.json", "utf8"));

// 1. Runtime version contract
const wantMajor = manifest.runtime.node.split(".")[0];
const have = process.version.replace(/^v/, "");
if (have.split(".")[0] !== wantMajor) {
problems.push("node major " + have + " does not match contract " + wantMajor);
}

// 2. Every runtime env var the app reads must be declared AND present
const missing = manifest.env.runtimeRequired.filter((key) => !process.env[key]);
if (missing.length > 0) {
problems.push("missing runtime env: " + missing.join(", "));
}

// 3. No build output may hardcode the primary host
function grepFiles(pattern, dirs) {
try {
  return execFileSync(
    "grep",
    ["-rIl", "--include=*.js", "--include=*.html", "--include=*.css", pattern, ...dirs],
    { encoding: "utf8" }
  ).trim();
} catch (err) {
  if (err.status === 1) return ""; // no matches: the good case
  throw err;
}
}

const hostHits = grepFiles(manifest.primaryHost, ["out", ".next"]);
if (hostHits) {
problems.push("primary host baked into: " + hostHits.split("\n").join(" "));
}

// 4. Cost and escape hatch: the artifact must be self-describing
if (!manifest.commit || manifest.commit.length < 12) {
problems.push("manifest is not pinned to a commit");
}

if (problems.length > 0) {
for (const p of problems) console.error("x " + p);
process.exit(1);
}
console.log("ok: artifact " + manifest.commit.slice(0, 12) + " is portable");
The failure output looks like this, and it's what you want to see the first time you run it:
$ node scripts/verify-artifact.mjs
x node major 22 does not match contract 20
x missing runtime env: DATABASE_URL, REDIS_URL
x primary host baked into: out/index.html out/_next/static/chunks/opengraph-a1b2.js
$ echo $?
1
After fixing the version pin, the env plumbing, and the OpenGraph URL builder:
$ node scripts/verify-artifact.mjs
ok: artifact a91c4f2e8b31 is portable
$ echo $?
0
Two of those three failures were real blockers for a standby deploy, and both would have surfaced mid-incident. That's the whole argument for the script.
Choosing a Secondary Deployment Target for Failover
Cold standby on another PaaS
Same framework, different platform, deployed from your artifact, scaled to zero or minimum. Cheapest in engineering effort for Tier 1 and Tier 2 apps where the framework has a first-class Node target.
The bill: a second set of secrets, a second set of domain config, and drift unless both deploys run from the same pipeline on every commit. Free tier works until you need concurrency headroom, at which point "cold" quietly becomes "warm enough" — which is the honest requirement anyway. A standby that takes 90 seconds to accept traffic after DNS is already flipped is not a standby.
Object storage plus CDN as a break-glass static tier
For a static export, this is the best ROI in the post. A bucket, a CDN distribution, TLS, and a deploy job that uploads out/. The cost is a rounding error and the RTO is DNS-bound.
You get a degraded but real product: static pages serve, client-side routing works, anything needing the API still fails. For a marketing site, docs site, or a storefront whose cart is a separate service, that's enough. For a dashboard behind auth, it's a nice status page and not much else.
Container target for full SSR parity
Build the image in CI, push to a registry neither platform owns, run it on a container host. Closest parity to an SSR primary: same Node process, same routes, same middleware — assuming the middleware isn't edge-runtime-only.
What it demands: an always-warm instance, a database reachable from the second network, and a session secret present in both places. This is the option most likely to work and the one most likely to rot if nobody deploys to it weekly.
What each option costs you in drift, secrets, and on-call attention
| Target | Monthly cost (est.) | Drift risk | Secret surface | On-call load |
|---|---|---|---|---|
| Cold PaaS standby | $0–20 | Medium | 2 platforms | Low if deployed every commit |
| Object storage + CDN | $1–10 | Low | 1 platform + bucket | Very low |
| Container standby | $10–40 | High | registry + host + DB | Medium |
Dollar figures are estimates for a small app. The drift column is what decides which row you pick.
Deploying to Two Targets from One Pipeline
One commit, two deploys, one source of truth
The standby is deployed on every commit to main, from the same artifact, by the same workflow. Deploy it manually "when we remember" and drift is guaranteed. The standby's job on a normal Tuesday is to prove it still works.
Structure the workflow as build → verify → publish artifact → deploy primary → deploy standby, with both deploy jobs consuming the identical tarball. Never let the standby rebuild from source independently.
Deploy ordering and idempotency so retries are safe
Order matters twice over: primary first keeps the release the source of truth, and a failed standby deploy must not block the primary. So the standby job is continue-on-error for pipeline purposes — but it has to open an issue when it fails. Silent standby failures are how you end up with a three-month-old standby.
Idempotency: every deploy is "promote artifact X to target Y," never "build something and push." Re-running a job promotes the same bytes, which is safe. Same rule applies to DNS changes later.
Handling provider-specific config without forking the app
Keep provider config in a deploy/<target>/ directory: the platform config file, the routing rewrite rules, the header policy. App code stays identical. Anything requiring an if (platform === ...) inside application code is a portability bug — move it to build time and bake it into the artifact via public env vars.
The one legitimate runtime branch is a feature flag: FEATURES.ONDEMAND_IMAGES = false on the standby, read from the manifest so both targets are explicit and diffable.
A GitHub Actions Workflow with Primary and Standby Jobs
name: deploy
on:
  push:
    branches: [main]
concurrency:
  group: deploy-main
  cancel-in-progress: false
jobs:
  artifact:
    runs-on: ubuntu-latest
    outputs:
      name: ${{ steps.pack.outputs.name }}
    steps:
      - uses: actions/checkout@v4
      - uses: actions/setup-node@v4
        with:
          node-version-file: .nvmrc
          cache: npm
      - run: npm ci
      - run: npm run build
      - run: node scripts/verify-artifact.mjs
      - id: pack
        run: |
          name="artifact-$(git rev-parse --short=12 HEAD)"
          tar -czf "$name.tgz" out build-manifest.json
          echo "name=$name" >> "$GITHUB_OUTPUT"
      - uses: actions/upload-artifact@v4
        with:
          name: ${{ steps.pack.outputs.name }}
          path: ${{ steps.pack.outputs.name }}.tgz
          retention-days: 30

  primary:
    needs: artifact
    runs-on: ubuntu-latest
    environment: primary
    steps:
      - uses: actions/download-artifact@v4
        with:
          name: ${{ needs.artifact.outputs.name }}
      - run: ./deploy/primary/promote.sh "${{ needs.artifact.outputs.name }}.tgz"
        env:
          PRIMARY_TOKEN: ${{ secrets.PRIMARY_TOKEN }}

  standby:
    needs: [artifact, primary]
    runs-on: ubuntu-latest
    environment: standby
    continue-on-error: true
    steps:
      - uses: actions/download-artifact@v4
        with:
          name: ${{ needs.artifact.outputs.name }}
      - run: ./deploy/standby/promote.sh "${{ needs.artifact.outputs.name }}.tgz"
        env:
          STANDBY_TOKEN: ${{ secrets.STANDBY_TOKEN }}
      - if: failure()
        run: gh issue create --title "standby deploy failed" --body "$GITHUB_RUN_URL"
        env:
          GH_TOKEN: ${{ secrets.GITHUB_TOKEN }}
The environment: keys are doing real work — each job gets its own secret scope without forking the app, and you can hang an approval gate on the standby if you want one. GitHub Actions specifics live in the Actions docs.
DNS Is the Actual Failover Switch
TTL budgeting and the pre-lowered TTL trick
Your RTO cannot be lower than your TTL plus resolver caching behavior. Check what you actually publish:
$ dig +noall +answer app.example.com
app.example.com.	3600	IN	A	76.76.21.21
An hour of TTL is an hour of mixed traffic — some resolvers on the old address, some on the new. That's not a cutover, it's a slow smear, and it generates confusing support tickets ("it works on my phone").
The trick: lower the TTL to 60 seconds at least 48 hours before a planned change window, and keep it low permanently if failover matters to you. Then verify from more than one resolver, because TTL is a maximum, not a promise, and a resolver may hold the answer longer if it chooses (the mechanics are in RFC 1035):
$ dig @1.1.1.1 +noall +answer app.example.com
app.example.com.	60	IN	A	76.76.21.21
$ dig @8.8.8.8 +noall +answer app.example.com
app.example.com.	41	IN	A	76.76.21.21
Differing remaining TTLs are normal caching, and they're why your failover plan needs a HOLD state rather than an instant "done."
Human-driven versus health-check-driven switching
Automated DNS failover is attractive and usually wrong at first. A health-check-driven switch can't tell "the primary is broken" from "our health check is broken from that region," and a false switch during a partial primary incident leaves you with two problems.
Start human-driven, with a mandatory dry run and an audit log. Graduate to automation only after several successful manual failovers and synthetic checks that have proven they don't flake. Automation is a reward for demonstrated reliability, not a substitute for it.
Avoiding the second outage: registrar and DNS provider as a third dependency
If DNS is the switch, the DNS provider is now the most critical component in your architecture. Two mitigations, both cheap:
- Use a DNS provider distinct from your hosting provider. That's the whole point. If the platform that hosts you also holds your zone, a control-plane outage can leave you unable to repoint anything.
- Keep registrar credentials and a zone export outside both. A
zonefile-backup.txtin a repo you control, updated monthly, plus documented registrar login recovery, is the difference between "repoint in five minutes" and "repoint after a support ticket."
Using a CDN or anycast front door as an alternative switch point
If DNS TTLs are too slow for your RTO, move the switch up a layer: put an anycast CDN in front, keep DNS stable, and change the CDN's origin between primary and standby. Propagation drops to seconds, and you keep one zone.
The trade: the CDN is now in your critical path and its own config becomes the thing to test. Pick one switch point and test that one. Two untested switches are worse than one.
Automating the Failover Decision
Signals that are reliable: multi-region synthetic checks against real user paths
Reliable signals share three properties: they exercise the actual user path, they run from at least three independent regions, and they require consecutive failures over a defined window. A check hitting /healthz proves the process is up. A check that loads the page, authenticates with a test account, and performs a read proves the product is up.
Signals that lie: status pages, single-region probes, and social media reports
- Status pages lag by design, are often written by the same control plane that's failing, and "investigating" is not a severity. They're context, not a trigger.
- Single-region probes produce false positives from that region's network rather than your service.
- Social media reports are the least reliable signal available and the fastest to arrive. They're what makes an on-call engineer switch DNS at 19:00 because a dashboard is slow.
No status page and no social post may trigger a switch on its own. They can raise the alert; only synthetic evidence can execute.
A conservative state machine: observe, confirm, switch, hold
Four states with explicit transitions:
| State | Condition to leave | Action |
|---|---|---|
| OBSERVE | 3 consecutive failures in 3+ regions over 4 min | Open incident, page on-call |
| CONFIRM | Same failure pattern persists at 8 min AND standby health is green | Prepare switch, notify |
| SWITCH | Named decision owner approves, ticket id recorded | Apply DNS change |
| HOLD | Fixed 30 min minimum, no auto-switch-back | Watch error rate on standby |
HOLD exists because the most common failover mistake is oscillating. Never auto-return to primary; a human does that after the primary has been stable for a period they choose.
A Failover Script with Mandatory Dry-Run and Audit Log
Dry run is the default. --apply is the opt-in. That inversion matters: the dangerous path should cost an extra keystroke under pressure.
import { appendFileSync } from "node:fs";


const args = process.argv.slice(2);
const has = (flag) => args.includes("--" + flag);
const val = (name) => {
const i = args.indexOf("--" + name);
return i === -1 ? undefined : args[i + 1];
};

const zone = val("zone");
const record = val("record");
const target = val("target");
const ticket = val("ticket");
const apply = has("apply");

if (!zone || !record || !target || !ticket) {
console.error("usage: failover.mjs --zone Z --record app --target standby --ticket INC-123 [--apply]");
process.exit(2);
}

function audit(event, extra) {
const line = JSON.stringify({
  ts: new Date().toISOString(),
  event,
  zone,
  record,
  target,
  ticket,
  mode: apply ? "apply" : "dry-run",
  actor: process.env.USER || "unknown",
  ...extra
});
appendFileSync("failover-audit.jsonl", line + "\n");
console.log(line);
}

audit("requested");

// 1. the standby must prove it is healthy before DNS moves
const healthUrl = "https://" + target + ".example.net/healthz";
const code = execFileSync(
"curl",
["-sS", "-o", "/dev/null", "-w", "%{http_code}", "--max-time", "10", healthUrl],
{ encoding: "utf8" }
).trim();

audit("standby_health", { status: code });
if (code !== "200") {
console.error("aborting: standby returned " + code);
audit("aborted");
process.exit(1);
}

// 2. read the current record so the change is a visible diff
const current = execFileSync("dig", ["+short", record + "." + zone], { encoding: "utf8" }).trim();
audit("current_record", { current });

if (!apply) {
console.log("DRY RUN: would point " + record + "." + zone + " away from " + current);
audit("dry_run_complete");
process.exit(0);
}

// 3. apply via the DNS provider's CLI (flarectl shown as an example)
execFileSync("flarectl", ["dns", "update", record, "--zone", zone, "--content", target + ".example.net"], {
stdio: "inherit"
});
audit("applied");
A rehearsal looks like this:
$ node scripts/failover.mjs --zone example.com --record app --target standby --ticket INC-4412
{"ts":"2026-11-05T19:02:11.884Z","event":"requested","target":"standby","ticket":"INC-4412","mode":"dry-run","actor":"dev"}
{"ts":"2026-11-05T19:02:12.517Z","event":"standby_health","status":"200","mode":"dry-run"}
{"ts":"2026-11-05T19:02:12.903Z","event":"current_record","current":"76.76.21.21","mode":"dry-run"}
DRY RUN: would point app.example.com away from 76.76.21.21
{"ts":"2026-11-05T19:02:12.904Z","event":"dry_run_complete","mode":"dry-run"}
That log file is what you show in the post-incident review. It answers who, when, what, and why — the questions a review will ask and CI logs won't answer six weeks later.
Rollback Automation You Can Trust
Immutable artifact promotion instead of rebuild-on-rollback
Rollback means promoting a previously built artifact, not re-running a build from an older commit. A rebuild is a new artifact with different lockfile resolution, different transitive dependency patches, and different build caching — sometimes better, sometimes subtly different, always slower under pressure.
Immutable promotion also keeps the standby consistent: rolling back primary and standby to the same artifact id is one number, not two git operations.
Rolling back data and schema, not just code
The failure mode nobody plans for: the reverse migration doesn't exist, or it deletes data the new code wrote. Rules that hold up:
- Deploy schema changes in expand/contract pairs, one release apart.
- Every migration must be backward compatible with the previous release for at least one deploy.
- A code rollback never rolls back data. A bad write is a data repair, reviewed separately.
If your rollback path requires a destructive down-migration, you don't have a rollback path.
Proving rollback works on a schedule, not in an incident
Put it on the calendar: monthly, promote N-2 to the standby, run the smoke suite against it, record the result. Fifteen minutes, and it catches exactly the drift that would otherwise show up at 02:00.
Testing the Failover Path
Test 1: build and deploy to the standby target from a clean runner
Fresh container, no cache, npm ci, build, verify, promote. Record the wall-clock time — that's your honest RTO floor for the deploy half, and it usually comes out 2–4× the estimate. It also catches secrets that only exist on a laptop.
Test 2: switch DNS inside a sandbox zone
Create failover-test.example.com, put two dummy origins behind it, run the failover script end-to-end against it with --apply. Verify by polling multiple public resolvers until all of them return the new address. Record the elapsed time; that's your DNS-bound RTO component, measured instead of assumed.
Test 3: simulate a control-plane outage by blocking provider API access
In CI or a lab, point the provider's API base URL at a blackhole (or drop the token) so every control-plane call fails. Then ask: can you build, verify, and promote the last artifact anyway? If the answer is no because the artifact only lives in the provider's build cache, that's the finding. The fix is the artifact bucket, not a better token.
Test 4: run the app with the primary provider's primitives removed
Set FEATURES.ONDEMAND_IMAGES=false, point KV at a local Redis, rip out the edge middleware, boot the server. This test will fail the first time, on something you forgot — a favicon rewrite, an analytics beacon, a preview comment script. Each failure is a checklist item, not a setback.
Test 5: fail over in the middle of an in-flight deploy
Start a deploy, kill the primary's deploy API mid-flight, run the failover path. What you're looking for: does the standby get the last complete artifact or a half-promoted one? Does the audit log tell you which artifact is live where? This resembles a real control-plane outage more closely than anything else on the list, and it's the one teams skip.
Recording results: what to log and what counts as pass
Log, per test: date, artifact id, executor, wall-clock time, and the failure that stopped it. Define pass narrowly:
- All five tests pass from a clean runner.
- Total measured time from alert to standby-serving-verified-traffic is under your stated RTO.
- Zero steps required a human action that isn't in the runbook.
- Every artifact id that went live is recoverable from the audit log.
Anything else is "partially verified," which in a review is the same as untested.
Observability You Need Before the Outage, Not During It
Synthetic checks that mirror login and checkout, not just the homepage
The homepage check passes during a database outage because it's cached. Your synthetic needs to set a session cookie for a test account, load an authenticated page, and — for commerce — add to cart and reach the payment intent step without charging. Run from three regions every 60 seconds, alert on 3 consecutive failures.
Deploy-time metrics as an early-warning signal
Track build queue time and deploy success rate as first-class metrics. A rising build queue is often the first visible symptom of a platform problem, arriving minutes before user-facing errors. It's a leading indicator for the control plane, which is precisely the failure mode that strands you without a shippable fix.
Alerts that name the runbook and the decision owner
Every alert should answer three questions in its first line: which runbook, which service, who can authorize a switch. An alert that says "5xx elevated" and nothing else sends the responder to read a dashboard — which may itself be down — and burns four minutes. Put the runbook URL in the alert body. It costs nothing and it works when the wiki is up.
Cost, Drift, and the Honest Trade-offs
What standby actually costs per month
Estimates for a small app, marked as estimates:
- Object storage + CDN static tier: $1–10
- Cold PaaS standby (scaled-down, deployed every commit): $0–20
- Warm container standby with a replica database: $40–200
- Second DNS/zone and monitoring: $0–30
- Engineering time to build and maintain the portable artifact: 3–8 days initially, then a few hours a month
The last line is the real cost and the one people forget to budget. The infrastructure is cheap; the discipline is what you're buying.
Drift is the failure mode that gets you
Not the outage — the standby that broke in March and nobody noticed. Drift is inevitable unless the standby is part of every deploy and the monthly tests actually run. Treat a failed standby deploy as a P2, not a warning, because a warning that's been firing for six weeks is not a warning.
When running single-provider is genuinely the right call
Sometimes it is:
- You're pre-product-market-fit and a two-hour outage costs you nothing you can't recover.
- Your standby would be a degraded shell that can't authenticate users — a page that says "we're having trouble" is a status page, not a failover.
- You don't have the on-call capacity to run two targets. An untested second target is a liability that consumes attention.
In that case, invest in the cheap half: portable artifacts, immutable deploys, tested rollback, and a status page a human writes to. That's most of the value for a fraction of the cost.
Vendor-Risk Review Questions for Deployment Platforms
Questions about control-plane independence and blast radius
Ask, and expect specific answers:
- Does your hosting control plane share infrastructure with your DNS, auth, or build systems? What's the blast radius of a failure in each?
- Can we deploy using a prebuilt artifact without touching your build system?
- What's the documented behavior of serving during a control-plane incident — do existing deployments keep serving?
- Is there a regional option, and does it isolate failures or just add a second shared dependency?
Contract, exit terms, and data egress
Exit terms matter more than entry terms. Ask about egress pricing for a full export, retention of build logs and artifacts after cancellation, how long a custom domain delegation survives account changes, and whether preview deployments contain customer data that must be exported. Egress plus retention is where "we can leave anytime" quietly becomes expensive.
Reading status page history as evidence rather than marketing
A status page's incident history is the only public data about failure behavior. Read the last 12 months for how often incidents hit serving versus dashboard, how long "investigating" lasts before a root-cause update, and whether postmortems get published. Uptime percentages hide the shape that matters — you care about the distribution of control-plane incidents, not the average.
Both Vercel's status page and Google Cloud's status dashboard publish that history; read it as evidence about failure modes, not as a marketing claim.
The Runbook, Short Enough to Use
First five minutes
- Confirm it's a runtime incident, not a dashboard incident: run the synthetic check manually from two regions.
- Open the incident channel, name the incident commander, post the artifact id currently live.
- Check the standby's health endpoint and the last standby deploy timestamp. If the standby deploy is older than 24 hours, that's your first problem.
- Do not touch DNS until step 1 shows user-facing failure.
Decision points and who can call the switch
- Who: incident commander, or the named on-call lead if the IC is unavailable. Exactly one person.
- What: run
failover.mjswith--applyand a ticket id. Everyone else watches the audit log. - When: 3 consecutive synthetic failures in 3+ regions over 8 minutes, with the standby confirmed healthy.
- After: no switch-back for 30 minutes minimum, then only on human authorization.
Post-incident reconciliation of both targets
Within 24 hours: confirm both targets are on the same artifact id, replay any migrations that only landed on one side, confirm secrets match in both environments, verify the DNS record is where you think it is. Then write down which of the five tests would have caught this, and run it.
Further Reading
- Vercel status page and incident history — the primary record of platform incidents; useful as evidence of failure shape rather than a marketing claim.
- Google Cloud status dashboard — incident history for Google Cloud services, including regional events.
- RFC 1035 — DNS implementation and specification, including the TTL semantics your failover RTO depends on.
- GitHub Actions documentation — job dependencies, environments, and artifacts used in the two-target pipeline above.
- nodejs/Release — the authoritative Node.js release schedule for pinning the runtime contract across both targets.
- Vercel Build Output API — the platform-specific artifact shape referenced in the portability discussion; useful for seeing exactly which parts are not portable.
The Vercel and Google London incidents themselves were reported by The Sunday Guardian and The Register on 5 November 2026 respectively; no vendor postmortem was available in the material used for this post, so no root-cause detail is asserted here.
Conclusion: What to Build First on Monday
Do these four things in order, and you'll have a tested failover path for JavaScript deploys — more capability than most teams that own two providers:
- Emit a build manifest and run
verify-artifact.mjsin CI. One afternoon. It catches the three bugs that would otherwise surface during an incident. - Move the artifact out of the primary platform. A tarball in an object bucket that neither provider owns. This turns a control-plane outage from "we can't ship" into "we can ship elsewhere."
- Lower your DNS TTL to 60 seconds and keep it there. Costs nothing, buys back the largest single chunk of RTO.
- Run Test 1 and Test 2 monthly and write the result down. A failover path with a measured time is a plan. Without one, it's a paragraph in a document nobody has opened since the last reorg.
The 5 November stories aren't really about managed platforms being unreliable or datacenters being risky. In both cases the redundancy was there and the transition was never exercised. Your generators may well be fine. Prove it by cutting the power on a Tuesday afternoon, while everyone is watching and nobody is panicking.
More posts

Vetting Heim Datacenter's European Expansion: Latency, Failover, and Exit Terms
A deep technical guide to vetting Heim Datacenter's Omnes Capital-backed European expansion, covering latency benchmarking, failover validation, and exit-term risk for engineering teams.

Adopting Safari Technology Preview 256 Without Breaking Stable Safari
A technical walkthrough of the platform features landing between Safari Technology Preview 255 and 256, separating cross-browser-safe capabilities from Safari-only ones and outlining a feature-detection plus CI-testing strategy that keeps stable WebKit users from regressing.

Benchmarking ERNIE 5.5 Flash Base: Separating Per-Token FLOPs From KV-Cache Bandwidth at 1M Context
A deep technical walkthrough of benchmarking ERNIE 5.5 Flash Base's 280B-parameter/14B-active MoE at 1M-token context, separating per-token FLOPs from KV-cache bandwidth costs.
Loading comments…